Graph & Token Flow
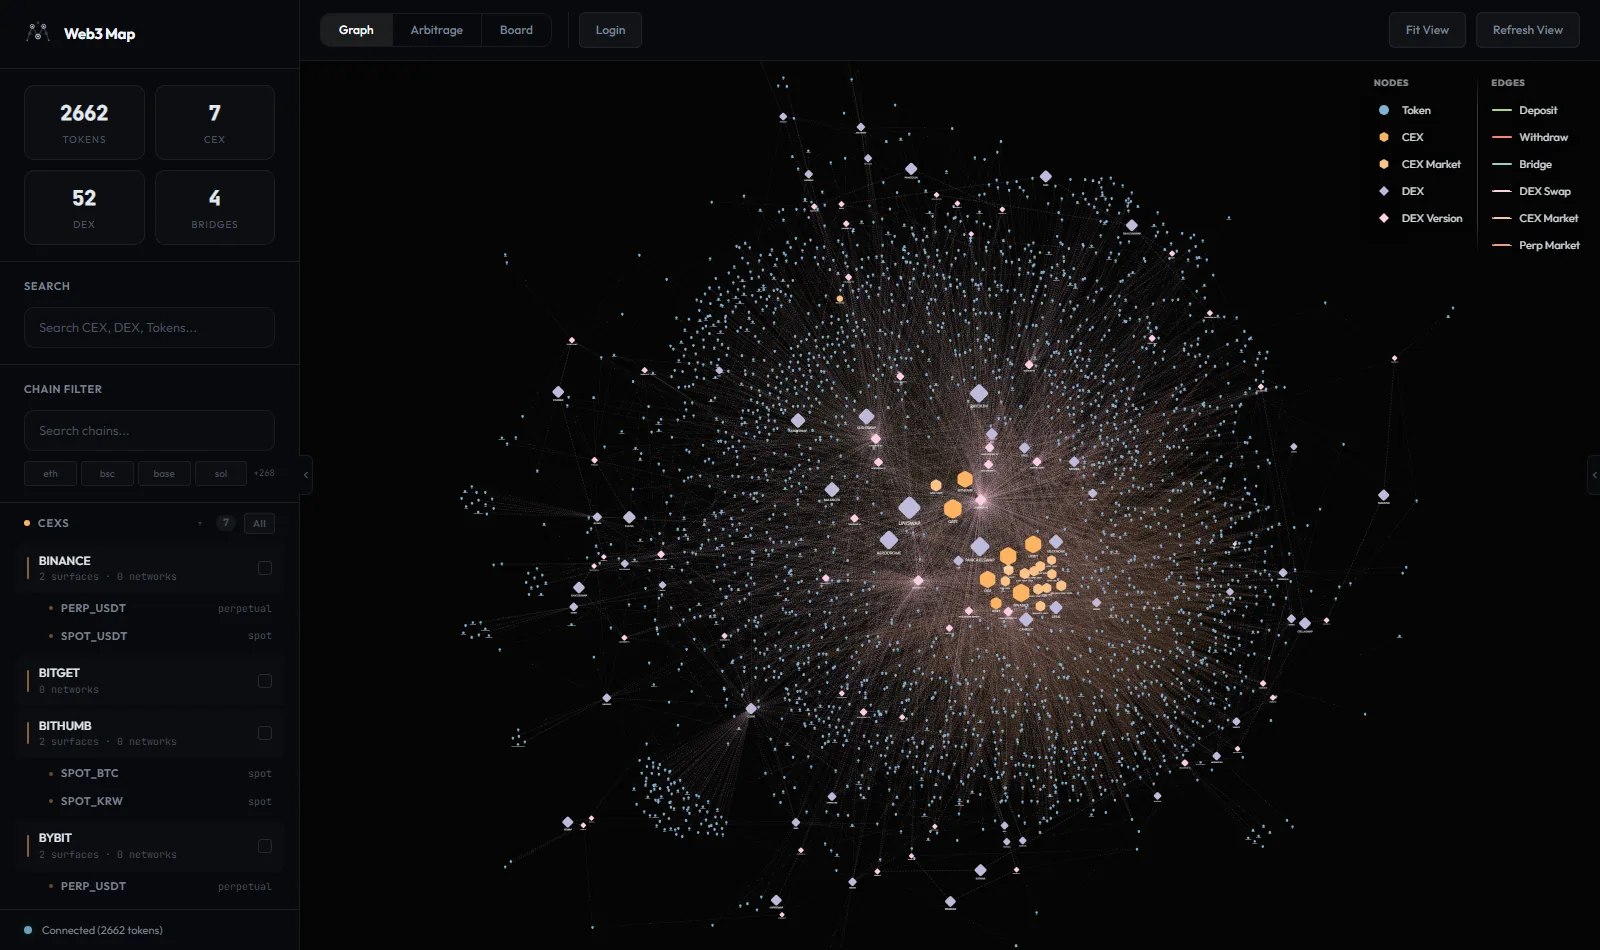
The Graph view maps every token, exchange, DEX, and transfer route Web3Map tracks into one interactive network, and Token Flow zooms that network down to a single asset.
The Graph view is the connectivity layer of Web3Map. Every other surface in the product (arbitrage cards, spike alerts, Telegram messages) tells you that a price gap exists. The graph tells you whether you could actually act on it: which chains a token lives on, which exchanges accept deposits and withdrawals for it right now, which DEX pools trade it, and which bridges connect the chains in between. A price signal without a transfer path is just a number. The graph supplies the path.
The screen renders five kinds of nodes and connects them with movement and structure edges:
Assets
Tokens, drawn as circles. One node per asset, even when the asset exists as different contracts on many chains.
CEX and CEX Markets
Centralized exchanges as hexagons. Exchanges with several market surfaces (for example spot USDT, spot KRW, perp USDT) show a parent hexagon plus one child hexagon per market.
DEX protocols and versions
Decentralized exchanges as diamonds. Multi-version protocols (for example a DEX with V2 and V3 deployments) show a protocol parent plus one child diamond per version.
Movement edges
Deposit and withdraw routes between chains and exchanges, DEX swap availability, perp market presence, and bridge routes between chains.
The page has two operating modes that share the same canvas:
- Graph mode.
The whole network at once. Use the sidebar filters and node clicks to isolate the part you care about. This is where you explore venues and routes.
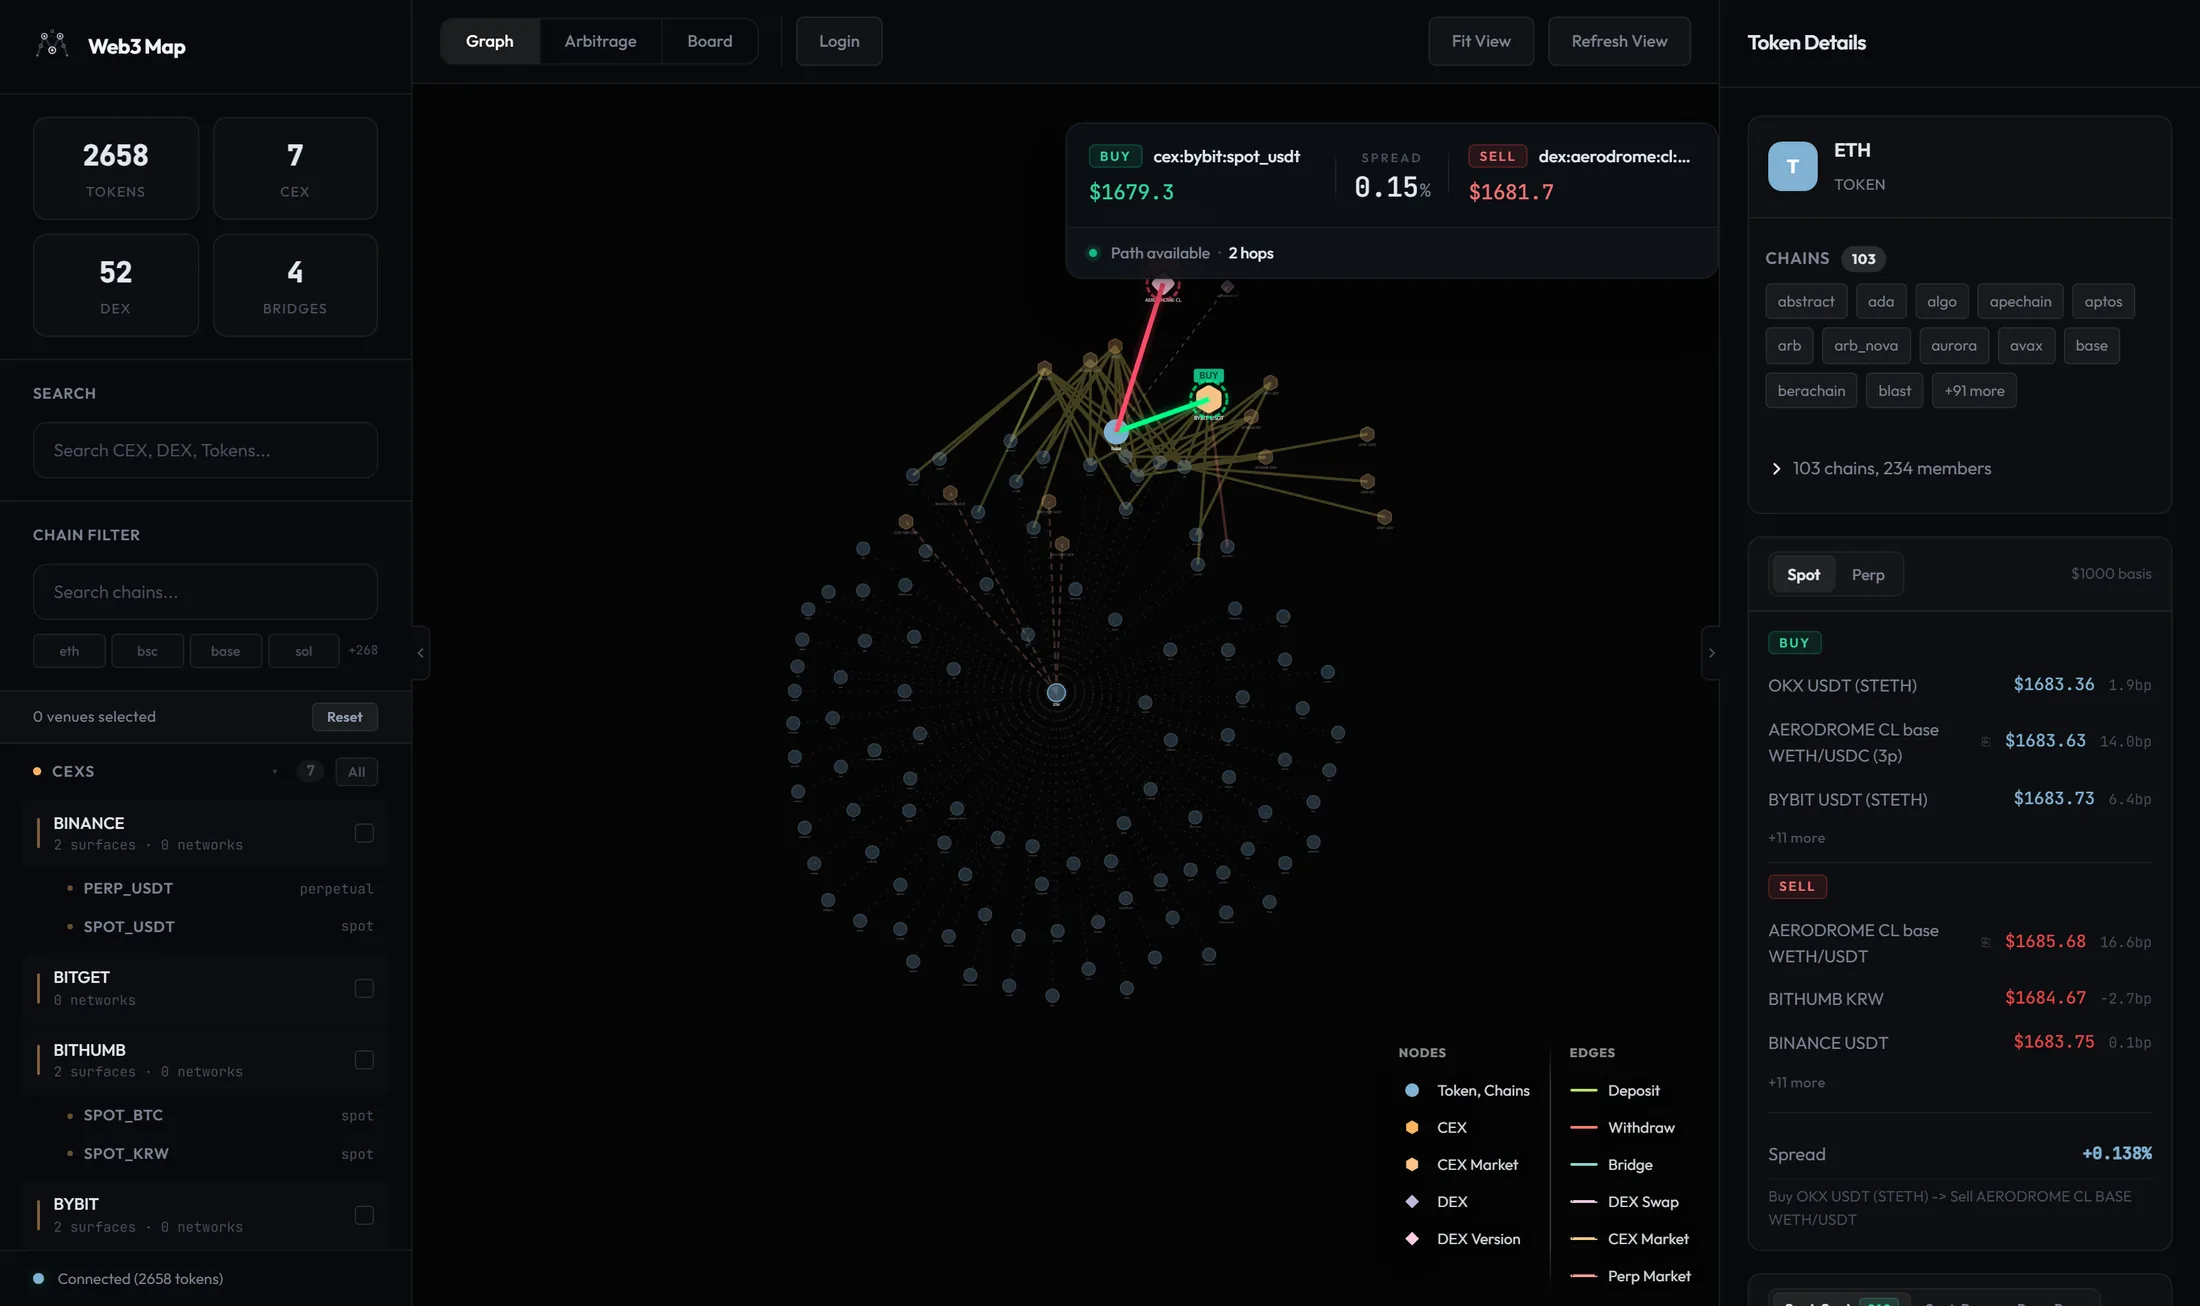
- Token Flow mode.
Click any token and the main graph hides while an asset-centric overlay takes its place: the token in the center, its chains around it, and every CEX, DEX, and bridge route that touches it. This is where you evaluate one asset. See Token Flow.
Note: Views are mounted lazily on first visit, so the very first time you open the Graph view you may briefly see Loading view.... After that, switching between Graph, Arbitrage, and Board is instant and your graph layout is preserved.
Toolbar
The toolbar runs across the top of the app on every view. Its contents adapt to the available width: at full width you get the segmented view switcher plus individual action buttons, below 900px the actions collapse into a single Actions menu, and below the mobile breakpoint a hamburger button appears for the sidebar.
- Graph / Arbitrage / Board view switcher
Switches between the three main views. On wide toolbars (720px and up) this is a segmented control; on narrower toolbars it becomes a dropdown showing the current view name with a chevron. Each option is a real link to
/graph,/arbitrage, or/board, so Ctrl/Cmd-click or Shift-click opens the view in a new tab while a plain click switches in place without reloading.- Arbitrage badge
While you are on another view, a small numeric badge can appear next to Arbitrage. The number is the count of new entries plus price spikes that arrived since you last looked at the Arbitrage view. Visiting the Arbitrage view marks everything as seen; the app records your last-seen time when you leave it and the badge counters reset. The badge is hidden when the count is zero.
- Fit View
Re-centers and zooms the camera so every visible node fits on screen, with a 400ms animation and comfortable padding. It targets whichever graph is currently active: the main network in Graph mode, or the Token Flow overlay when an asset is open. Use it after heavy filtering or after dragging the view somewhere unhelpful. The button is hidden while you are on the Arbitrage view because there is no graph canvas there.
- Refresh View
Forces a refetch of the data behind the page: stats, assets, the graph itself, opportunities, spikes, DEX pools, and worker health. It also reheats the force simulation so the layout settles again with the new data. While the refetch runs the button reads Refreshing... and is disabled; on success it turns green and reads Refreshed for 1.5 seconds before returning to Refresh View. You rarely need this because data streams in live, but it is the fastest way to recover after a long laptop sleep.
- Login
Shown when you are browsing as a guest. Takes you to the login page where you can sign in, create an account, or continue with a wallet.
- My Page and the nickname button
When you are signed in, the auth cluster on the right shows a My Page link (your account, billing, and alert settings) plus a button with your nickname (truncated with an ellipsis if long) and a logout icon. Clicking the nickname button signs you out on the spot: your session is replaced with a guest token immediately, with no page flicker.
- Actions menu (toolbar narrower than 900px)
On compact layouts the individual buttons fold into one dropdown. Menu order: Login or Logout ({nickname}) first, then Fit View (omitted on the Arbitrage view), then Refresh View with the same Refreshing... and Refreshed states. A My Page button still appears next to the menu for signed-in users.
- Mobile hamburger
On small screens a hamburger button (accessible label Toggle sidebar) sits at the left edge of the toolbar. It opens the left sidebar as a full overlay so you can search and filter, then closes again when you pick a result.
Heads up: The nickname button in the toolbar is the sign-out control. There is no confirmation dialog. One click and you are instantly back on a guest session, which means premium-gated data on screen falls back to the public feed. Use My Page if you meant to open your account instead.
Left sidebar
The left sidebar (300px wide on desktop, an overlay on mobile) is the control room for the Graph view: live counts, search, the chain filter, the venue browser, display toggles, and an API status indicator. On the Arbitrage view the same sidebar swaps to arbitrage filters instead; those are covered in the Arbitrage dashboard guide.
Stats cards
Four cards at the top summarize what is currently loaded: Tokens, CEX, DEX, and Bridges. Values show - while data is loading. The DEX number counts protocols, not versions: a protocol with three deployed versions counts once, and a standalone single-version DEX also counts once. The Bridges card hides itself entirely when the count is zero.
Search
- Search input
Placeholder reads Search CEX, DEX, Tokens.... Searching starts from the first character with a 200ms debounce. Results combine two sources: an instant match over the loaded graph nodes (exact match ranks first, then prefix matches, then substring matches; single-character queries only match exactly) and a server-side asset search whose results are merged in with duplicates removed.
- Result groups
Results are grouped under three headers: CEX (up to 4 results), DEX (up to 4), and Tokens (up to 8). Clicking a token opens its Token Flow. Clicking a CEX or DEX isolates that venue's subgraph and opens its details panel. Either way the search box clears, the mobile sidebar closes, and if you were on another view the app switches to the Graph view first.
Chain Filter
The chain filter sits at the top of the sidebar's scroll area and stays pinned (sticky) while you scroll. It restricts the whole graph to the chains you pick.
- Search chains... input
Type to get up to 10 chain suggestions; each suggestion shows the number of assets on that chain so you can see at a glance how much of the graph it covers.
- Popular chain buttons
One row of the four most popular chains (ranked by asset count, descending) for one-click filtering, followed by a +{N} hint showing how many more chains exist beyond the row.
- Selected chain tags and Clear
Every selected chain appears as a tag with an ×; click a tag to remove that single chain, or click Clear on the right to drop the whole filter.
What the filter actually does: token nodes stay visible only if the asset exists on at least one selected chain; deposit, withdraw, and other edges stay visible only if their chain set intersects your selection; nodes that lose all their edges to the filter are hidden too, so the graph never shows orphaned venues. The Venue Browser list below also shrinks to venues related to the selected chains.
Venue Browser
The venue browser lists every CEX and DEX as a selectable tree. Selecting venues builds a combined subgraph of just those venues and their connections.
- Focus bar: {N} venue selected / {N} venues selected + Reset
Appears at the top of the browser whenever a subgraph is active. The Reset button clears the subgraph and closes the details panel, returning you to the full network.
- CEXs section
Marked with an orange dot, an expand arrow, and a count badge, with an All button on the right that selects or deselects every CEX at once (the button shows an active style when everything is selected). Exchanges are sorted by supported network count, descending. Each row shows the exchange name plus a meta line: {N} surfaces · {M} networks for multi-surface exchanges, or just {M} networks. A check mark on the right shows selection state. Multi-surface exchanges expand into child rows, one per market surface, named by market type (for example
spot_usdt,spot_krw,perp_usdt) with the contract type or the word surface on the right.- DEXs section
Marked with a purple dot, a count badge, and its own All button. Inside it splits into two subsections, EVM and Non-EVM, each with its own expander, count badge, and All button. Protocols are sorted by number of deployment chains, descending. A multi-version protocol row reads {N} versions · {M} chains; a single-version protocol shows its chain list instead. Version child rows show the version name and either the single chain name or {N} chains.
- Parent and child selection semantics
Clicking a parent toggles the parent and all of its children together. Deselecting any child also deselects the parent; selecting every child auto-selects the parent. The resulting subgraph is the union of all selected venues: parents contribute a 2-hop neighborhood (so their versions or surfaces and everything those touch stay visible), other venues contribute 1-hop. The details panel follows the selection: one logical venue opens its node detail, several open a combined panel titled {N} Venues, and clearing the selection closes the panel. On mobile the sidebar closes automatically after a selection so you can see the result.
When the chain filter is active the venue browser respects it: CEXs are kept if their deposit, withdraw, or perp edges touch a selected chain, and DEXs are kept if any of their versions are deployed on a selected chain.
Display
- Labels chip
Toggles node labels on the canvas. Default on. Even with labels on, they only render after the layout finishes settling; while nodes are still moving, labels and edge particles are suppressed to keep the animation smooth. Hovering a node always shows its label regardless of this toggle.
- Show All chip
Controls whether single-source assets appear. Default off. A single-source asset is one reported by fewer than two independent data sources and not yet quality approved; these are hidden by default because a token seen by only one venue cannot be price-compared across venues and is more likely to be noise. Turning Show All on includes them, but renders them heavily dimmed (15% opacity) so they never visually compete with cross-venue assets. The same rule filters the Supported Assets list in the details panel: with the chip off, only multi-source assets are listed there.
API status dot
At the very bottom of the sidebar a colored dot and label report the backend's readiness: Checking API... while the first check runs, then Connected ({N} tokens) (or just Connected if the token count is unavailable), or Disconnected if the API is not ready. The check polls the API health endpoint every 15 seconds.
Note: This dot reflects API readiness, not the realtime websocket. The websocket has no on-screen indicator; if it drops, the app silently falls back to REST polling and the only visible effect is a slower update cadence. See Freshness & realtime.
Reading the graph
Everything on the canvas encodes meaning: shape is the entity type, size is connectivity, line style is live health. The on-screen legend panel in the bottom-left corner summarizes this with two sections, Nodes and Edges.
Node types
| Legend label | Shape | What it represents |
|---|---|---|
| Token | Circle | An asset. One node per asset across all of its chains. Token nodes keep a fixed base size; they do not grow with connection count. |
| CEX | Rounded hexagon | A centralized exchange. For multi-surface exchanges this is the parent node that groups the market surfaces. |
| CEX Market | Hexagon (smaller) | One market surface of an exchange, such as a spot USDT market, a spot KRW market, or a perp USDT market. |
| DEX | Rounded diamond (largest) | A DEX protocol. For multi-version protocols this is the parent that groups the versions. |
| DEX Version | Diamond | A specific protocol version, for example a V3 deployment, which is what actually holds pools. |
Venue node size scales with the number of connections on a logarithmic curve, so a venue with hundreds of listings is visibly larger without dwarfing the canvas. Parent nodes (a CEX with multiple surfaces, a DEX protocol with multiple versions) additionally absorb their children's connection counts, which is why major exchanges and protocols read as the biggest shapes on screen. Hovering any node enlarges it and draws a white outline.
Edge types
| Legend label | Connects | Meaning |
|---|---|---|
| Deposit | Chain to CEX | You can deposit this asset from that chain into the exchange. |
| Withdraw | CEX to chain | You can withdraw this asset from the exchange to that chain. |
| Both (merged) | Chain and CEX | When deposit and withdraw both exist between the same chain and exchange, they merge into a single edge. Its hover label reads Both (deposit + withdraw), or Deposit only / Withdraw only when filters or live status reduce the effective direction. |
| DEX Swap | Token to DEX | The token is tradable on that DEX. Dashed line. |
| CEX Market | CEX parent to market surface | Structural edge linking an exchange to one of its market surfaces. Dashed line. Not a transfer route. |
| Perp Market | Token to CEX | A perpetual futures market for this token exists on that exchange. Dashed line. This signals market presence only; it is not a transfer path because perps are margin positions, not token movements. |
| Bridge | Chain to chain | A bridge route connects the two chains. Bridge edges are listed in the legend but are intentionally hidden on the main graph: there are too many of them and rendering them all would slow the view down. They appear where they matter, in Token Flow and in the arbitrage overlay. |
Live status styling on transfer edges
Deposit and withdraw edges are restyled continuously from exchange status data that is refreshed every 30 seconds. The line style is the health signal:
| Line style | Status | Meaning |
|---|---|---|
| Solid, full color | Fresh and viable | Status was confirmed within the last 3 minutes and at least one token mapping on this route is enabled. |
| Long dashes, full color | Warning | Status data is 3 to 5 minutes old. The route probably still works, but the confirmation is aging. |
| Gray, dashed | Stale, never updated, or disabled | Status data is more than 5 minutes old, was never recorded, or no token mapping on the route is currently enabled. Treat the route as unusable until it recovers. |
These style updates are applied in place when status changes arrive over the realtime channel, so the layout never reshuffles just because an exchange paused a wallet.
Rendering details worth knowing
- On the full network, deposit/withdraw route edges are drawn faint and thin on purpose; they sharpen up when you isolate a subgraph or hover a node.
- Edge opacity adapts to zoom: zoomed out, edges fade so the cluster structure reads clearly; zoomed in, they brighten for tracing individual routes. Hovering a node restores its edges to full strength.
- Edges that touch a token node carry a single slow-moving particle showing flow direction. Particles are disabled on mobile and while the layout is still settling.
- Multiple edges between the same pair of nodes are curved apart so they never overlap into one line.
Tip: In Token Flow mode the same legend panel is reused with one change: the first Nodes entry becomes Token, Chains, because the flow draws both the central token and its chain nodes as circles.
Interactions
Every element on the canvas is interactive. The pointer changes to a hand over anything clickable.
- Click a venue node (CEX, CEX market, DEX, DEX version)
Isolates that venue's neighborhood as a subgraph: 1 hop for ordinary nodes, 2 hops for a multi-version DEX protocol or a multi-surface CEX parent so the versions or surfaces and everything they connect to stay visible. The details panel opens for the node and the camera zooms to fit the subgraph. The graph snapshots node positions before isolating, so leaving the subgraph restores the layout exactly.
- Click a token node
Opens that asset's Token Flow overlay and the Token Details panel. Token clicks use a strict hit test with a small movement tolerance, so a click that drifts more than a few pixels counts as a drag and will not open the flow by accident.
- Click an edge
Focuses both endpoints: they enlarge to their hover size while every other node fades to 50% opacity, and the visible subgraph becomes the union of both endpoints' 1-hop neighborhoods. The details panel shows the edge detail and the camera zooms to fit.
- Click the background
Clears any focus, subgraph, and open panel, restores the node positions saved before the subgraph was opened, and zooms back out to fit the whole network. This is the universal "take me back" gesture.
- Hover
Hovered nodes enlarge with a white outline and show an HTML tooltip. Node tooltips contain the node's name in bold, a
Type:line (token, cex, cex market, dex, or dex protocol), aSurface: {market_type}line for CEX market nodes, aChains:list, and for exchanges aNetworks:count of supported networks. Edge tooltips follow fixed patterns per type, listed below.- Drag
A press that moves the pointer is treated as a drag, not a click, so repositioning the view never accidentally selects a node or opens Token Flow. The click handlers only fire when the pointer stays within a small movement threshold.
Edge tooltip patterns
| Edge type | Tooltip pattern |
|---|---|
| DEX swap | Swap / {asset} <-> {quote} / DEX: {dex} |
| Perp market | Perp Market / {asset} / CEX: {cex} ({market_type}) |
| CEX market (structural) | CEX Market / {from} -> {to} |
| Deposit / withdraw / merged | Deposit, Withdraw, Both (deposit + withdraw), Deposit only, or Withdraw only / {asset} / CEX: {cex} / Chains: ..., plus a Mappings: {N} count when filters or live status have narrowed the effective direction |
| Bridge (Token Flow only) | {Protocol} | {symbol} on the first line (for example Stargate V2 | USDC), then {from} → {to} |
Token Flow
Token Flow is the asset-centric mode of the graph. Instead of the whole network, you get one token in the center with everything that token can touch arranged around it: its chains, the exchanges that accept it, the DEXs that trade it, and the bridges that move it between chains. The main graph hides and pauses underneath while the flow is open; clicking the background closes the flow and returns you to the network exactly where you left it.
Four ways to open it
- Click a token node
on the main graph.
- Pick a token from search.
Any result under the Tokens group in the sidebar search opens that asset's flow.
- Follow an asset link from the Arbitrage view.
Clicking an asset symbol on an arbitrage card jumps to the Graph view with that asset's flow open.
- Use a deep link.
A URL with
?asset={id}(a positive integer asset id) always enters the Graph view and opens that asset's Token Flow. This is how shared links and Telegram alert links land you on the right token.
The flow combines three data sources: the asset's detail record (its member tokens per chain), a market-data feed refreshed every 30 seconds (CEX prices, perp prices, exchange status, DEX pools, perp states, bridge routes), and the graph's own edges.
Node anatomy
| Node | Appearance | Details |
|---|---|---|
| Central token | Translucent circle, labeled with the asset's primary symbol | The asset itself. Connected to each of its chain nodes by a faint dotted line. |
| Chain nodes | Solid circles, labeled with the chain id | One per chain where the asset exists. These are the anchors that deposit, withdraw, bridge, and DEX edges attach to. |
| CEX / CEX market nodes | Hexagons | Every exchange (or specific market surface) that has a deposit, withdraw, or perp relationship with this asset. |
| DEX nodes | Diamonds | Only DEXs with confirmed pools for this token are drawn: the market data must contain at least one pool matching the chain, the DEX version, and the token. A DEX that merely lists the protocol without an actual pool for this asset does not appear. |
Edge anatomy
| Edge | Drawn between | Behavior and tooltip |
|---|---|---|
| Deposit / Withdraw | Chain node and CEX node | Deposits point chain to exchange, withdrawals point exchange to chain. When both directions exist for the same pair they merge into a single "both" edge, colored yellow when both directions are viable and gray otherwise. Tooltips: Both (deposit + withdraw) {symbol} on {chain}, Deposit {symbol} from {chain}, Withdraw {symbol} to {chain}. Live status styling applies just like on the main graph: solid when fresh, long dashes on warning, gray dashes when stale or disabled. |
| Bridge | Chain node and chain node | Solid mint line. If routes exist in both directions the edge is drawn once without arrowheads; a one-way route gets a direction arrow. Tooltip: {Protocol} | {symbol} on the first line (the protocol name in title case, for example "Stargate V2") and the chain pair on the second. Bridge routes from the live market data are merged in alongside the graph's own bridge edges. |
| DEX link | Chain node to DEX node | Dashed pink line. Tooltip: DEX: {dexLabel}. |
| Perp link | Central token to CEX node | Dashed line from the token itself, not from a chain, because a perp market is presence rather than a transfer path. Tooltip: Perp market on {cexLabel} ({market_type}). |
Clicks inside the flow
- Click a chain node
Toggles that chain in the global Chain Filter (and shows the node's details in the panel). This is the fastest way to narrow a multi-chain asset down to the one or two chains you would actually route through; the price panel and bridge card react immediately.
- Click a CEX or DEX node
Leaves the flow and jumps to that venue's subgraph on the main graph, exactly as if you had clicked the venue there. Use this to pivot from "what can move this token" to "what else does this venue support".
- Click the central token
Re-opens the token's panel content if you had navigated the panel elsewhere.
- Click an edge
Opens a flow edge detail in the panel: route endpoints, the tooltip info line, the live Status card for deposit/withdraw edges, or the bridge details card filtered to that chain pair for bridge edges.
- Fit View
The toolbar button works inside the flow too, refitting the camera to the flow's nodes.
Details panel
The details panel docks on the right (350px wide on desktop, full width on mobile) and renders different content depending on what you selected: a node, several venues, an edge, an asset, or a node/edge inside Token Flow. With nothing selected it shows No Selection with the hint Click on a node or edge to see details and the footer note click or tap to select. The header title is the node's name when a node is selected, {N} Venues for a multi-venue selection, Token Details for an asset, and Details otherwise.
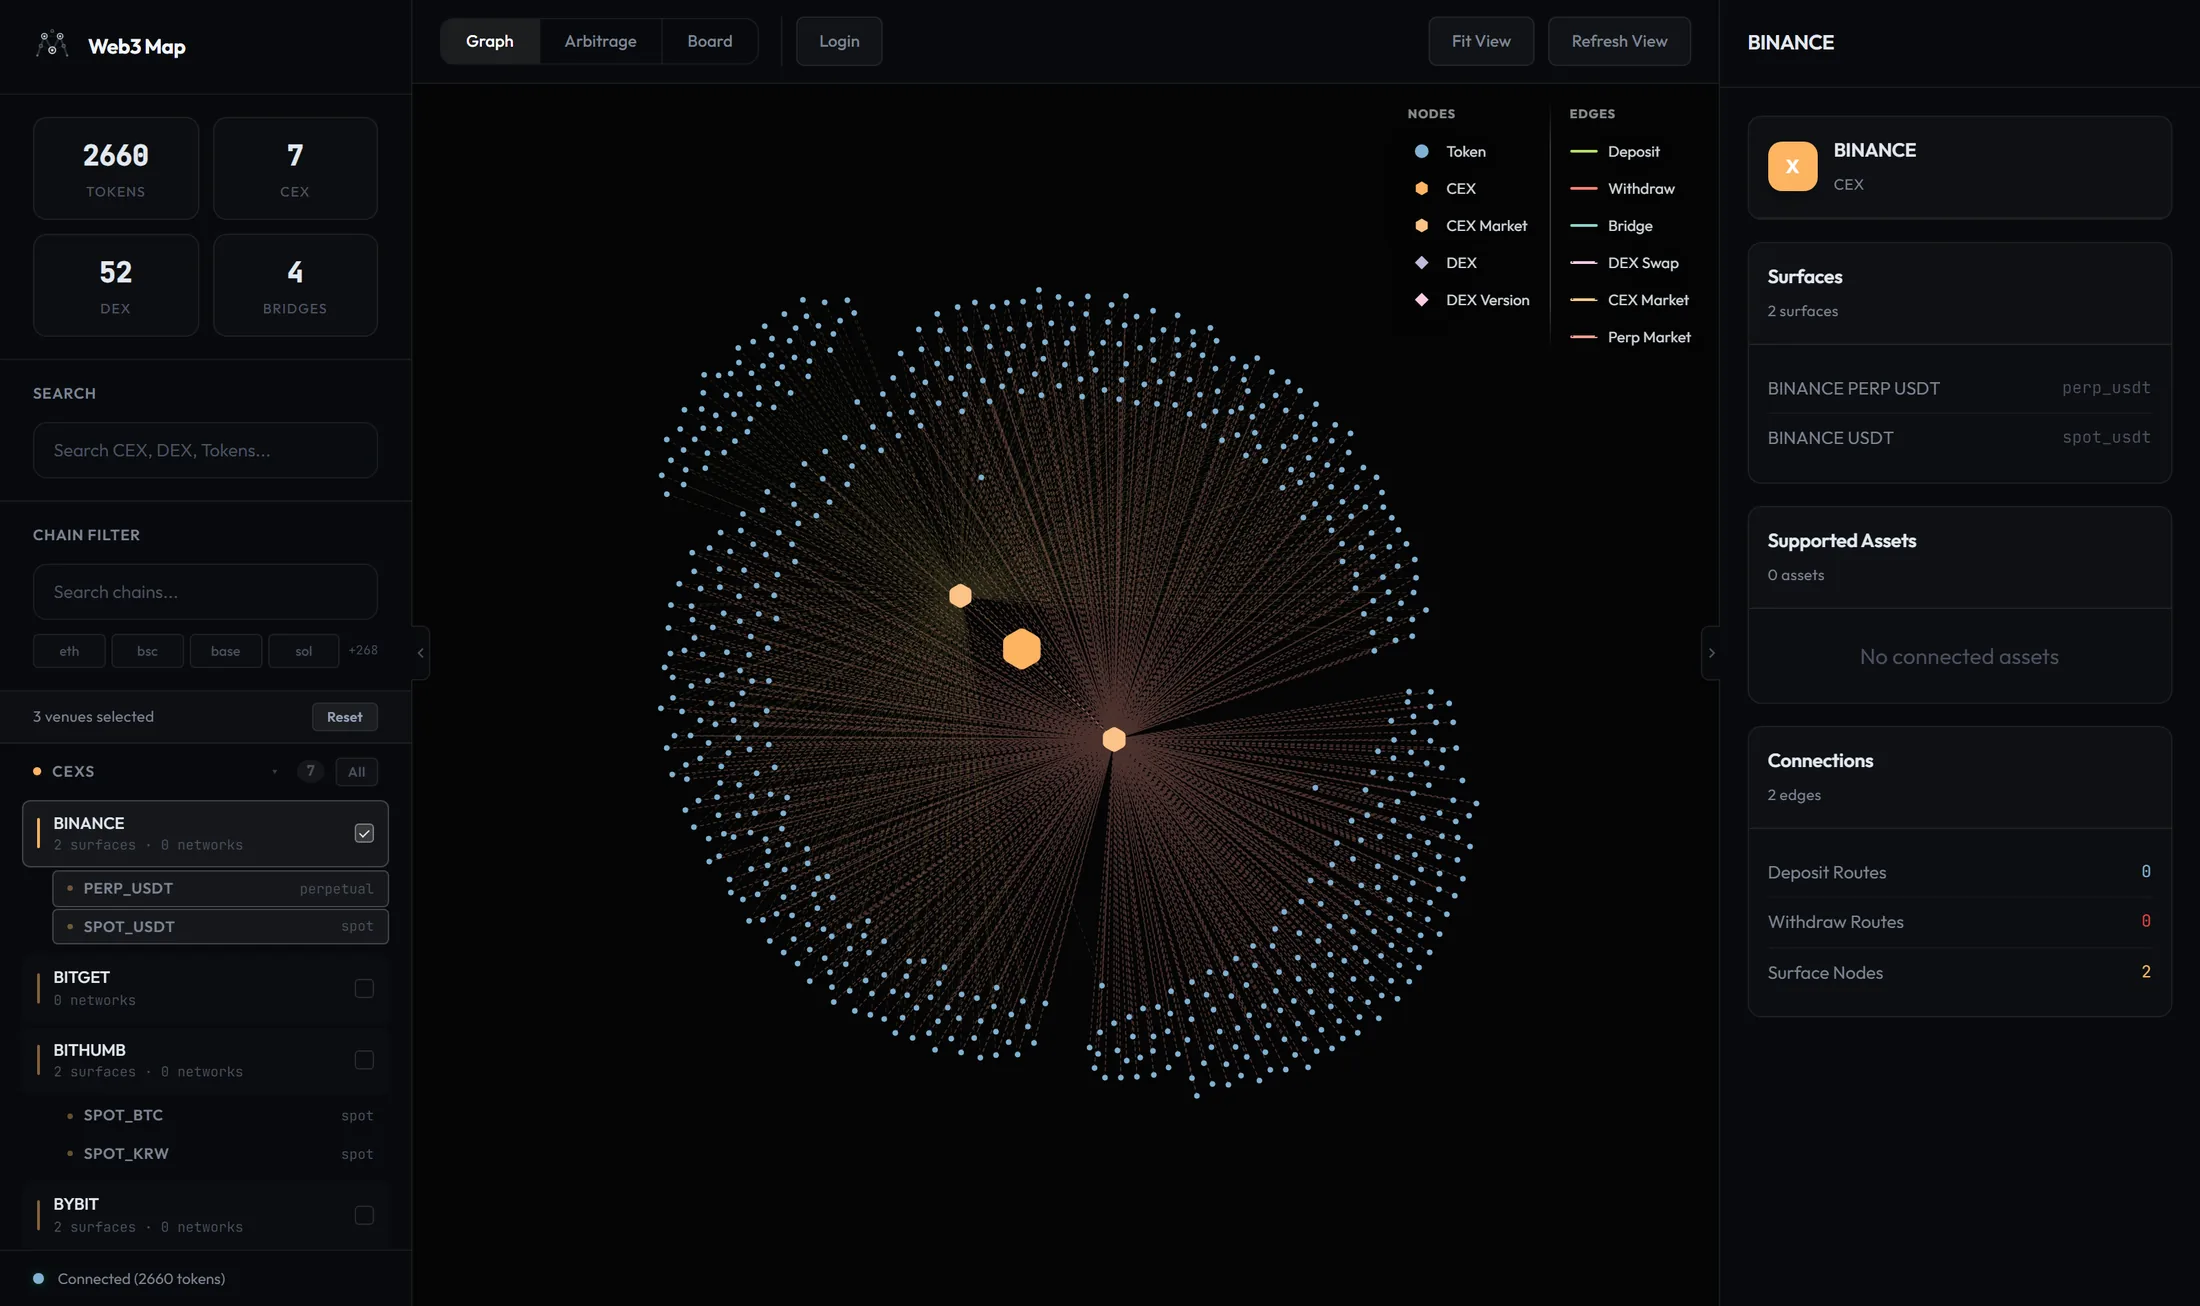
Node detail (venues)
- Header card
An icon letter on the node's type color (C for tokens, D for DEX nodes, X for CEX nodes), the node's name, and a type label: TOKEN, DEX PROTOCOL, CEX MARKET, CEX, or DEX. Clicking the header re-isolates the node's subgraph if you have wandered off it.
- Chains section
A tag per chain with a count badge in the section title. For exchanges the networks are ordered by how many assets use them; for DEXs these are deployment chains. Every tag is clickable and toggles that chain in the global chain filter (active tags get a highlighted background). More than 12 chains collapse behind +{N} more with a show less to fold back.
- Versions card (multi-version DEX protocols)
Subtitle {N} versions; each row shows the version label and its {N} chains count.
- Surfaces card (CEX nodes)
Subtitle {N} surfaces; each row shows the surface label and its market type, contract type, or the word surface.
- Supported Assets card
Subtitle {N} assets. A tag grid of every asset connected to this venue through deposit, withdraw, or perp edges (for CEXs) or swap edges (for DEXs). The grid honors the Show All chip: with it off, only multi-source assets are listed. Clicking any tag opens that asset's Token Flow. Collapses past 12 with +{N} more / show less; an unconnected venue shows No connected assets.
- Connections card
Subtitle {N} edges. Counts by category: Deposit Routes (green), Withdraw Routes (red), Surface Nodes (orange, CEX only), Perp Markets, and Bridge Routes (blue). Zero-count rows are mostly hidden to keep the card tight.
Edge detail
- Header
An icon with the type's first letter, the type label, and the subtitle Active. Type labels: Deposit, Withdraw, Both (Deposit + Withdraw), Bridge, Swap, DEX Version, CEX Market, Perp Market.
- Body rows
DEX edges show Pair (formatted
{asset} <-> {quote}) and DEX. CEX edges show Pair, CEX, and a Surface row when a market type applies. Other edges show plain From and To rows. CEX and DEX edges also get a clickable Chains tag section that toggles the chain filter.- Token Mappings section
For edges that carry token mappings (bridges and similar), each row pairs a
{chain_id} {coin}badge with a{cex_id} {coin}badge joined by ->. Clicking a row opens that asset's Token Flow. More than 20 mappings collapse behind +{N} more.- Appended cards
If the edge belongs to a specific asset, an asset summary card follows, then node detail cards for both endpoints, so one edge click gives you the full context of everything it touches.
Asset detail (the Token Flow panel)
Selecting an asset stacks three blocks in order: the asset summary card, the price panel (with the bridge card slotted between its sections when bridge data exists), and the Venues card.
- Loading and error states
While loading: Loading token details.... If the asset is gone: Token details unavailable with This asset is unavailable or no longer visible. If you are rate limited: Too many token detail requests with Selected asset requests are rate limited. and, when the server says how long to wait, Try again in {N}s. If your plan cannot access it: Your account cannot access this selected asset view. Any other failure: Could not load token details with Retry the selected asset request. Every error state includes a Retry button.
- Venues card
Subtitle shows the total venue count. The CEX section lists each exchange with a route label describing exactly what it supports for this asset: deposit + withdraw + perp, deposit + withdraw, deposit + perp, withdraw + perp, only deposit, only withdraw, or perp market. The DEX section lists protocols (versions deduplicated to one row per protocol). More than 8 entries collapse behind +{N} more / show less; with no venues at all the card reads No connected venues.
Tip: The route label is the quickest viability read for an asset. only deposit on the buy exchange means you can get the token in but not out, and only withdraw on the sell exchange means you cannot deliver into it. Both legs need the right half of deposit + withdraw for a transfer-based route.
Asset summary card
- Header
A T icon on the asset color, the primary symbol, and the label TOKEN. Clicking the header opens (or re-opens) this asset's Token Flow, switching to the Graph view if needed.
- Chains tags
One clickable tag per chain with a count badge; tags toggle the chain filter and collapse past 12.
- Member tokens row: {N} chain(s), {M} member(s)
A collapsible row (chevron to expand) listing the actual on-chain contracts behind the asset, grouped by chain. Each member shows its symbol and identifier abbreviated to the first 8 and last 6 characters. Click an identifier to copy the full value; the row confirms with Copied! for 1.5 seconds. If your chain filter excludes every member the list reads No members match the current chain filter.
Safety: The member token list is the ground truth for contract addresses. Before sending funds anywhere, copy the identifier from here rather than retyping it, and confirm the chain group matches the chain you intend to use. Two members of the same asset on different chains are different contracts.
Flow node and flow edge details
Selecting a node inside Token Flow shows the asset summary card and price panel, plus, for non-central nodes, a small card identifying the node with a type label of Chain, CEX Market, CEX, DEX, or Asset; clicking that card's header jumps to the venue's subgraph on the main graph. Selecting an edge inside the flow shows a compact token summary (icon A, symbol, TOKEN, and a Chains count), the price panel, and an edge card typed Both, Deposit, Withdraw, Perp, or DEX with the subtitle Token Flow Path and From / To / Info rows. Bridge edges swap in the bridge details card filtered to that chain pair.
- Status card (deposit/withdraw flow edges)
Subtitle Real-time. For each direction (Deposit, Withdraw) it shows Enabled in green or Disabled in red, a Freshness row whose value is colored green for
fresh, yellow forwarning, and red for anything else, and a CEX Key row in the form{cex_id}:{coin}:{cex_network}identifying the exact exchange wallet behind the status. If a mapping exists but no status has been recorded the card reads No status data available.
Price panel
The price panel is the core of the asset view: a live, ranked price comparison across every venue that trades the asset, refreshed every 30 seconds from the asset's market-data feed. The card header always carries the note $1000 basis: every price shown is a simulated fill of $1,000, not a top-of-book tick. That single rule is what makes a thin DEX pool comparable with a deep exchange book. A pool that can only absorb $1,000 at a bad effective price ranks exactly where it deserves to.
States before data arrives: Loading prices… while loading, Could not load prices. with a Retry button on failure, and No price data available when the feed is healthy but empty for this asset.
Spot tab
- Buy section
Venues ranked by buy price, ascending, so the cheapest place to acquire the token is on top. Rows carrying the Transfer blocked or Fallback badge are pushed toward the bottom of the ranking regardless of price, because a great price you cannot move or fully trust is not a great price.
- Sell section
Venues ranked by sell price, descending, so the best place to dispose of the token is on top. The same deprioritization rules apply.
- Row anatomy
Each row shows the venue label, the simulated fill price, and the row's spread in basis points (
{spread}bp). Venue label formats: CEX rows read like BINANCE USDT or UPBIT KRW (exchange plus quote market; when the quote coin differs from the market name it is appended in parentheses). DEX rows read like UNISWAP V3 eth (protocol, version, chain), with a pool count suffix such as (3p) when several pools back the quote. Prices use dynamic decimal precision, and extremely small values are compacted into a leading-zeros notation (for example$0.0(zeros)digits) so micro-cap prices stay readable.- +{N} more / Show less
Each section shows its top three rows by default and folds the rest behind these toggles.
- Fallback badge
Marks a price derived from a fallback quote, such as a partial fill where the order crossed the book but did not complete at full size. Fallback prices are kept on screen because they are still information, but they rank last and the client-side spread calculation only uses them when no primary price exists for that venue.
- Transfer blocked badge
Appears on a CEX row when the leg's transfer direction has no path in the graph for the currently selected chains: no withdraw route on the buy side (you could buy but not take the tokens out) or no deposit route on the sell side (you could not deliver tokens in to sell). The price is real; the route around it is not.
- Stale rows
Rows whose price freshness is stale render at half opacity across the entire row, and they are excluded from the Spread calculation entirely. A faded number is a historical fact, not a live quote.
- Spread row
When a valid pair exists, the panel computes a client-side spread from the best non-stale buy and sell rows: a green
+{pct}%figure with the explanation Buy {VENUE} -> Sell {VENUE} underneath, naming the exact pair of venues that produce it.- Pool id copy (DEX rows)
On DEX rows the venue label doubles as a copy button for the pool identifier: its hover title shows the pool id and clicking copies it, confirming with Copied! and a check mark. The button only exists when the API response includes the pool id, which depends on your plan's data access.
If the tab has no rows at all it reads No spot price data.
Perp tab
The perp tab uses the same buy and sell ranking but only over perpetual futures markets, labeled like BINANCE PERP. There is no deposit or withdraw gating here: perp positions are opened with margin, so nothing needs to move on-chain and the Transfer blocked badge does not apply. Below the ranking, each perp market gets a state block with four fields:
| Field | Content | Why it matters |
|---|---|---|
| Funding | The current funding rate as a percentage with four decimals, colored green when positive and red when negative | Funding is the recurring payment between longs and shorts. Its sign tells you which side of a basis position earns and which pays. |
| Next | Countdown to the next funding event as {h}h {m}m, or now when imminent, plus the funding interval as /{N}h | Funding is settled at fixed intervals; timing entries around the next event changes what you actually collect or pay. |
| OI | Open interest, abbreviated in dollars (for example $x.xM) | A proxy for how much size the market can absorb. |
| Mark | The mark price | The price the exchange uses for margining, which is what your position is actually measured against. |
Empty state: No perp price data.
Degraded mode
If the market-data query fails and there is no cached data to fall back on, the panel shows a red banner reading Market data unavailable - arbitrage temporarily paused and suspends the client-side spread calculation. This is a deliberate hard stop: rather than computing a spread from data it cannot verify, the panel computes nothing.
Hard gate: Web3Map treats unknown data as failed data everywhere, and the price panel is no exception. A missing spread during the degraded banner is not a bug. It is the panel refusing to show you a number it cannot stand behind.
Arbitrage overlay
When a Token Flow is open and the opportunity feed contains an opportunity for that asset, the flow graph draws the trade on top of the map: which venue to buy at, which to sell at, and the chain path or missing bridge in between. The overlay is driven by the Arbitrage card inside the price panel.
The Arbitrage card
- Spot-Spot / Spot-Perp / Perp-Perp tabs
Each tab carries a badge with its opportunity count and lists that category's opportunities for this asset. The selected tab also switches the on-graph overlay mode, so the card and the canvas always describe the same trade type. Spot-Spot is the default.
- Opportunity rows
Each row leads with Spread and a green
+{pct}%, then badge state: Bridge when the route needs a bridge and one exists, Need bridge when it needs a bridge and none exists. Rows that are not executable render at 55% opacity with their blocked reason, or simply Blocked. Below that, a Buy row and a Sell row each name the venue and price. Venue formats match the price panel: UNISWAP V3 eth for DEXs, BINANCE USDT for spot markets, BINANCE PERP USDT for perp markets. The card shows up to five rows plus +{N} more; with nothing to show it reads No opportunities.
How the overlay picks what to draw: on Spot-Spot it considers this asset's spot opportunities that pass your chain filter, whose buy and sell venues are present in the flow, and whose spread is positive, then picks one by priority (a route that exists beats a bigger spread, then larger spread wins, then fewer hops, then bridge status). On the perp tabs it takes the largest spread of that type, enriched with live funding and open interest; if a perp tab has no perp opportunity the overlay falls back to the spot one. The feed itself refreshes every 30 seconds on premium and every 60 seconds on the public tier.
On-graph visuals
| Element | Appearance | Meaning |
|---|---|---|
| Path emphasis | Nodes on the trade path enlarge to 1.8x; everything off-path dims to 25% opacity (the central token stays bright) | Focuses the eye on the venues and chains the trade actually uses. |
| Action badges | BUY (green) and SELL (red) for spot; LONG (cyan) and SHORT (pink) for perp legs, pinned above or below the venue node | Which leg happens where. If both legs land on the same venue, the badges stack above and below it. |
| Glow rings | Dashed circles around the leg venues: green or cyan on the buy/long side, red or pink on the sell/short side; split into half rings when both legs share one node | Keeps the legs identifiable even when zoomed out past badge legibility. |
| Path lines (route exists) | Solid lines hop by hop: the first hop from the buy venue is green, intermediate bridge hops are amber, the final hop into the sell venue is red | The literal route: exchange withdraw or DEX swap out, bridge across, deposit or swap in. |
| Path lines (route missing) | Green lines from the buy venue to its chains and red lines from the destination chains to the sell venue, with the gap drawn as an amber dashed segment carrying the label BRIDGE NEEDED {from} → {to} | Shows exactly which chain pair lacks a bridge route, so you know what is missing rather than just that something is. |
| Perp lines | Straight lines from the central token to each perp venue, glowing cyan for the long side and pink for the short side | Perp legs have no transfer path, so the overlay draws relationships, not routes. |
The overlay card
A summary card floats top-center over the graph. Left block: the buy or long side, with its action badge, venue label, and price shown to five significant digits; DEX venues include a pool id copy button (hover title shows the id, click confirms with Copied and a check). Center: the word Spread over the percentage. Right block: the sell or short side in the same format. The footer line below reports route state:
| Footer | Indicator | Meaning |
|---|---|---|
Path available with · {N} hop(s) | Green dot | A complete transfer route exists between the legs, in N hops. |
Bridge required with the missing pairs listed as {from} → {to} | Amber dot | The legs sit on chains with no bridge route between them in Web3Map's registry. The spread is real but you would need an external way across. |
| Different token contract with the chain name and both abbreviated identifiers | Pink dot | Both legs are on the same chain but reference different token contracts. They are not directly transferable as-is; the hover tooltip tells you to verify convertibility (for example a wrap or unwrap relationship) before treating this as one token. |
| Funding rate with a next-funding countdown, OI, and the Perp arb badge | Cyan dot | Perp mode footer: the live funding picture for the perp leg(s) instead of a transfer route, since no tokens move. |
Heads up: Different token contract is the easiest footer to misread. The spread between the legs is genuine, but the two contracts may be wrapped variants, bridged derivatives, or entirely unrelated tokens that share a symbol. Confirm there is a real, liquid conversion between the two contracts before counting the spread as capturable.
Bridge details
Wherever a bridge route is relevant (the asset panel, a flow node, or a bridge edge inside Token Flow), a bridge details card summarizes the routes for the current asset. The header shows a B icon, the protocol name (the bridge id in title case, comma-separated when several protocols serve the asset), and the subtitle {N} route(s).
- Chains filter tags
Tags for every chain appearing in this asset's bridge routes; clicking one toggles the global chain filter, same as everywhere else. With one chain selected, routes match if it is either endpoint; with two or more selected, both endpoints must be selected chains. More than 12 tags collapse.
- Route rows
Each row reads
{from_chain} → {to_chain}with badges on the right: the route's transfer modes in green, and a route type badge of pool (liquidity-pool based transfer) or oft (mint-and-burn OFT transfer). If the token symbol differs across the two sides, the row labels it as{from_symbol} -> {to_symbol}. Five rows show by default; the rest fold behind +{N} more routes / Show less.- Load bridge route details button
The card initially summarizes from the graph's bridge edge enrichment (fee, credit, estimated time). Pressing this button fetches the full route detail, adding the fee breakdown, rate, both pool TVLs, and modes. While fetching it reads Loading bridge route details.... Error states: Bridge route details unavailable with Bridge route details are unavailable for this asset. (not found), Too many bridge route requests (rate limited), Your account cannot access this bridge route view. (plan restriction), or Could not load bridge route details with Retry the bridge route request. An asset with no routes reads No bridge routes available for this asset., and a chain filter that excludes everything reads No bridge routes match the current chain filter.
Metric reference
| Metric | Format | What it tells you |
|---|---|---|
| Total Fee | USD, abbreviated (for example $1.2K) | The full estimated cost of sending this asset over the route. |
| Native Fee | USD, abbreviated | The portion of the total paid in the source chain's native gas token. |
| Protocol Fee | USD, abbreviated | The portion charged by the bridge protocol itself. |
| Credit | {amount} {symbol}, or ∞ {symbol} | The route's remaining OFT transfer credit, which caps how much can currently move in this direction. ∞ means unlimited. A value below 1 renders in red: the credit is nearly exhausted and the route is likely not viable for any meaningful size right now. |
| Rate | Ratio | The quoted conversion rate between the source side and the destination side of the route. |
| Src TVL | USD, abbreviated | Liquidity in the source-side pool. Available only after loading full details. |
| Dst TVL | USD, abbreviated | Liquidity in the destination-side pool, the side that actually pays you out. |
| ETA | {N}s or {N}m | Estimated delivery time for the transfer. |
Only metrics with data render, so a sparse grid usually means the summary tier is showing and Load bridge route details will fill in the rest.
Tip: Read Credit and Dst TVL together before relying on a route. Credit caps how much the protocol will accept in this direction, and destination TVL caps what the receiving pool can pay out. Either one near zero makes the route theoretical regardless of the fee.
Freshness & realtime
Every live number on this page carries an age signal, and the encoding differs by surface. This table is the decoder ring:
| Surface | Fresh | Warning | Stale or disabled |
|---|---|---|---|
| Price rows (Spot and Perp tabs) | Full opacity, included in the Spread calculation | n/a (prices are fresh or stale) | Entire row at 50% opacity, excluded from the Spread calculation |
| Deposit/withdraw edges (graph and Token Flow) | Solid line in the edge color (status updated under 3 minutes ago) | Long dashes in the edge color (status 3 to 5 minutes old) | Gray dashed line (status over 5 minutes old, never recorded, or no enabled mapping) |
| Status card Freshness value | fresh in green |
warning in yellow |
Any other value in red |
| Fallback prices | Marked with the Fallback badge regardless of age, ranked behind primary prices, and used in spread math only when no primary price exists for the venue | ||
How the data reaches your screen
The app maintains a realtime websocket to the backend, authenticating with its first message. The server pushes price snapshots and update notifications over it, and the app injects them straight into its data cache, which is why edge styles and price rows change without any visible reload. The connection is considered live from the moment the first message arrives, not merely when the socket opens.
If the websocket drops, the price and status hooks automatically switch to REST polling: every 30 seconds on premium, every 60 seconds on the public tier. The client also runs periodic safety refetches while disconnected and retries the websocket with exponential backoff (it stops retrying only if authentication is rejected). The practical consequence: there is no error banner for a dropped websocket, and the sidebar status dot will still read Connected ({N} tokens) because it tracks API readiness, not the socket. The only symptom of a websocket outage is that updates arrive on the polling cadence instead of instantly.
Note: Graph and Token Flow features themselves are not plan-gated: nodes, filters, the legend, panels, and the bridge card behave the same for everyone. Plan differences on this page come through the data: the polling fallback cadence (30s premium vs 60s public) and whether the API includes pool and contract identifiers, which is what the pool id copy buttons depend on.
Heads up: Faded means excluded, not just old. A stale price row is dropped from the spread math, and a gray dashed edge means the route fails Web3Map's freshness gate. If a route you care about is gray, wait for the status poller to confirm it again rather than assuming it still works.