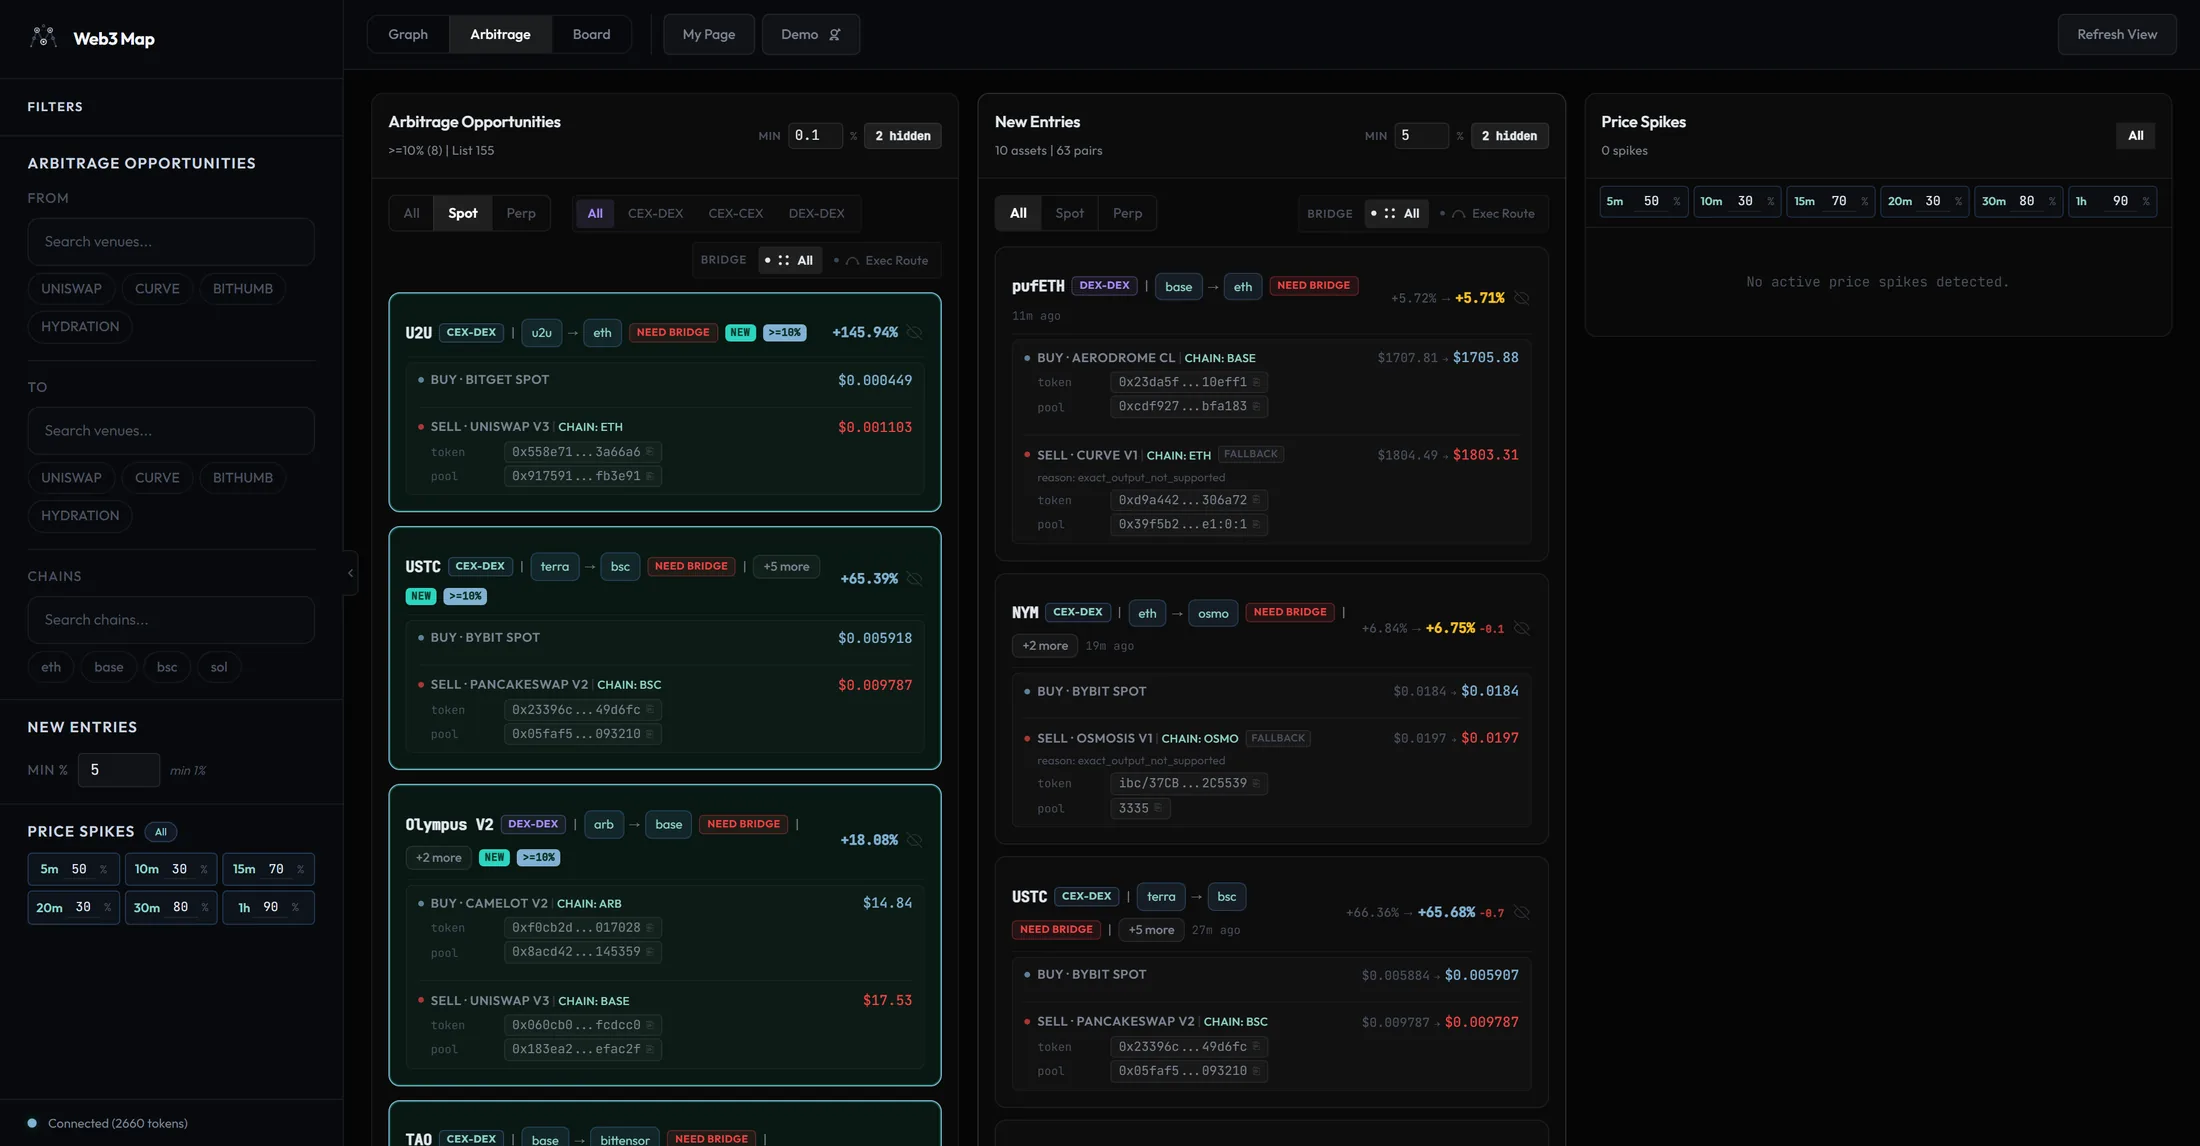
Arbitrage dashboard
A live, three-panel board of cross-venue price gaps: current opportunities, newly opened gaps, and sudden single-venue price spikes.
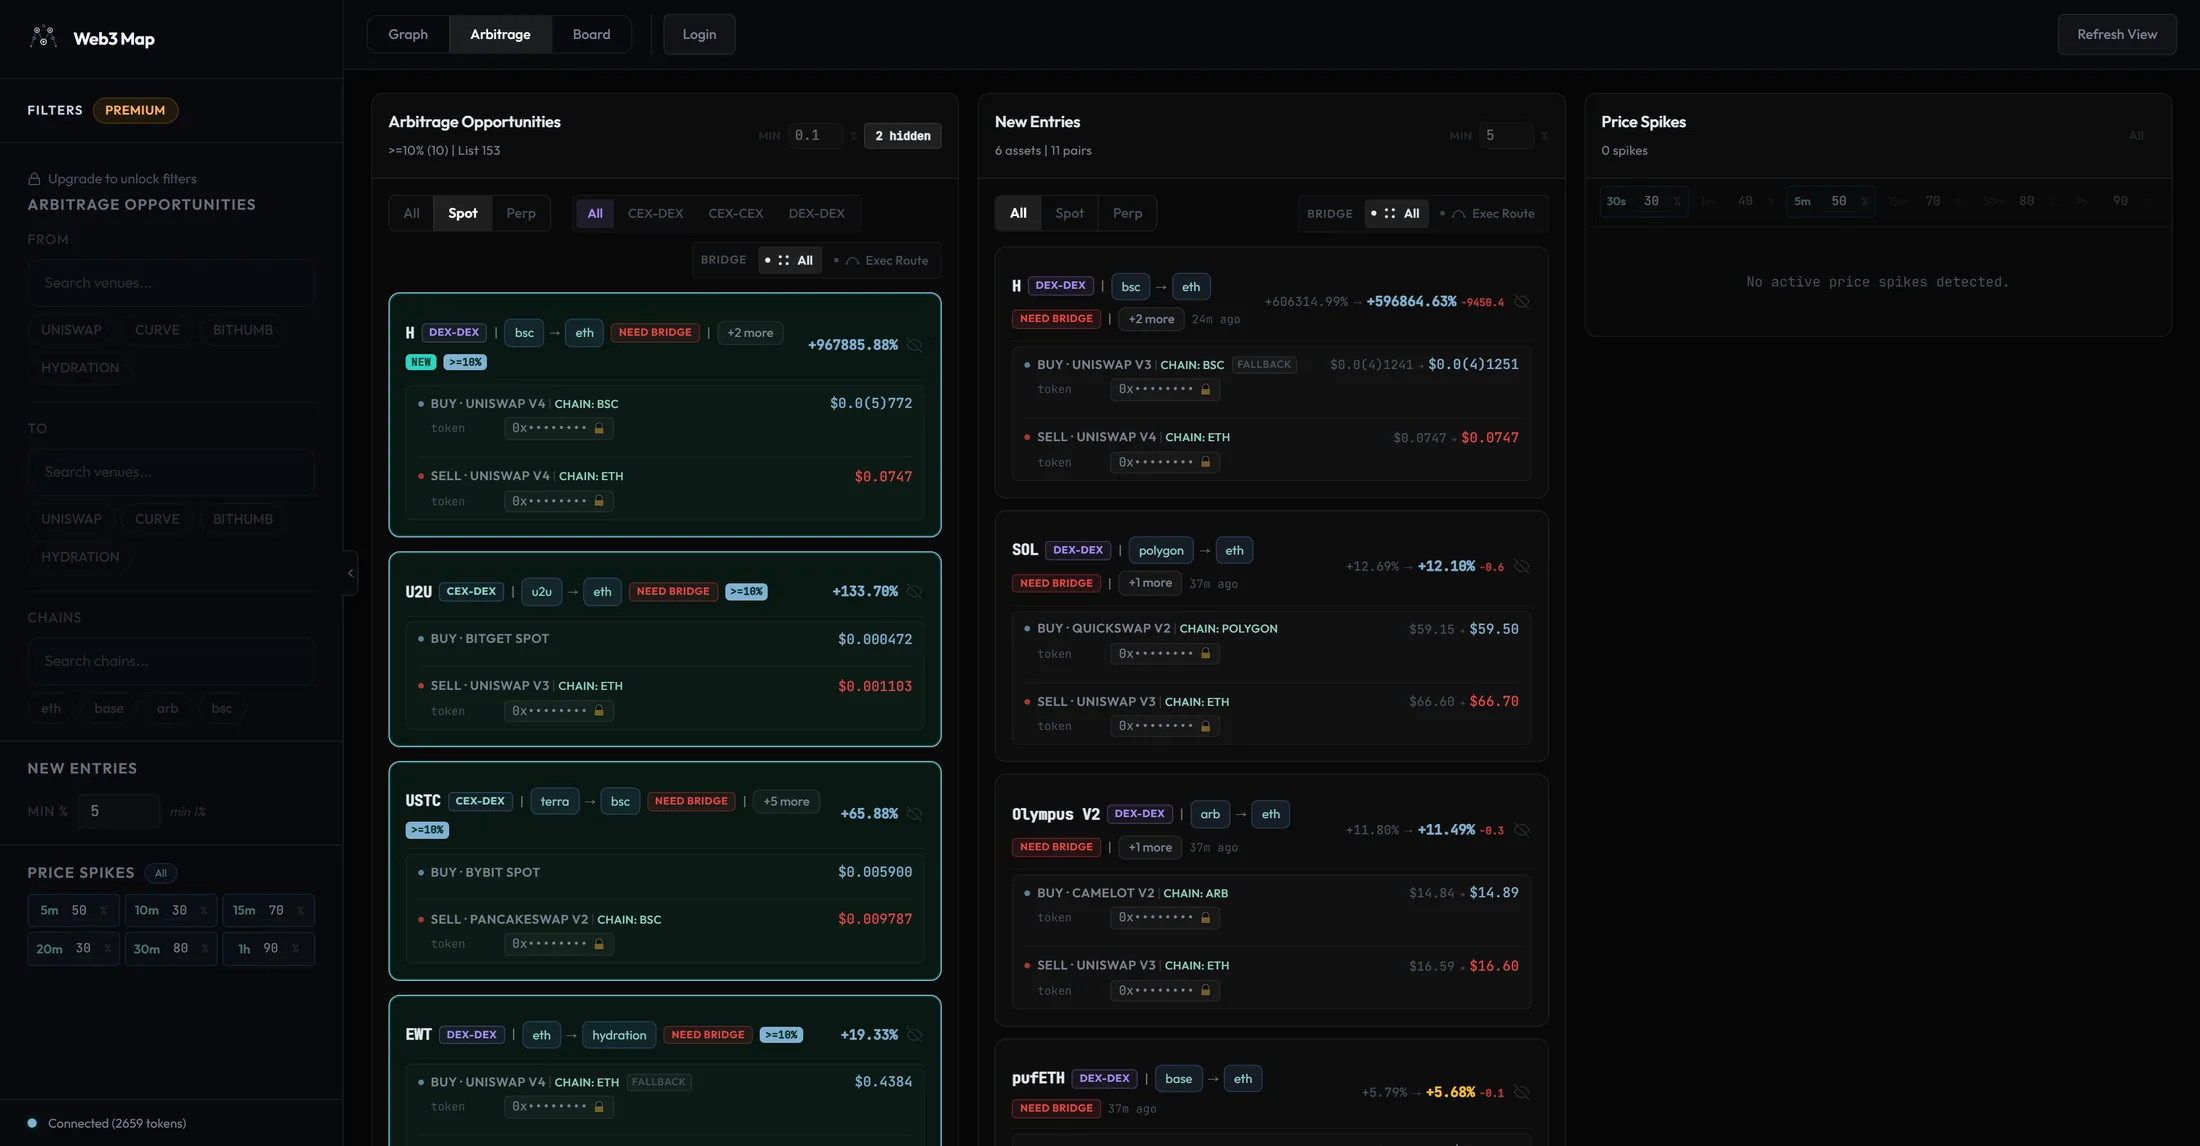
The arbitrage dashboard lives at /arbitrage. You do not need an account to open it: if no session exists, the app signs you in as a guest automatically and serves the public data feed. A Pro account unlocks editable thresholds, venue and chain filters, contract addresses, and a faster refresh cadence. The differences are summarized in Free vs Pro on this screen.
The view is built from three independent panels:
Arbitrage Opportunities
The current snapshot of positive-spread opportunities across CEX spot, CEX perp, and DEX venues, grouped by asset and sorted by spread.
New Entries
Opportunities whose buy/sell pair entered the book recently, inside a server-defined window of about 1 hour. Sorted newest first, with entry-versus-now comparisons.
Price Spikes
Sudden price moves on a single venue, classified as Buy Drop (price collapsed, cheap buy) or Sell Rise (price jumped, expensive sell), measured over six time windows.
Responsive layout
How many panels you see at once depends on the window width. Nothing is lost at smaller sizes; panels move behind tabs.
| Window width | Layout |
|---|---|
| Under 1000px | Single column with a three-tab bar at the top: Arbitrage, New Entries, Price Spikes. The New Entries and Price Spikes tabs carry unseen-count badges. |
| 1000px to 1799px | Two columns. The left column toggles between Arbitrage and New Entries via tabs; the Price Spikes panel is always visible on the right, so its tab button is hidden. |
| 1800px and wider | The tab bar disappears and all three panels render side by side. |
Tip: Switching between Graph, Arbitrage, and Board in the top toolbar keeps each view mounted in the background, so your tab selection, expanded groups, and scroll state on the dashboard survive a round trip to the Graph view.
Data feed and refresh cadence
Every panel reads from server-built snapshots, not from raw exchange streams. The backend assembles a consistent snapshot of opportunities and spikes, releases it, and the dashboard polls for the latest release. This is why all numbers on screen move together rather than ticking independently.
| Audience | Dashboard refetch | Snapshot visibility | Extra feeds |
|---|---|---|---|
| Guest / Free (public) | Every 60 seconds, including while the tab is in the background | Public consumers see each snapshot about 3 seconds after it is released | New Entries are derived from the public opportunities snapshot; spikes come from the public spikes feed |
| Pro (premium) | Every 30 seconds, including while the tab is in the background | Reads the release directly | Dedicated premium feeds for new gaps and spikes, which also carry the filter floors and the supported spike windows |
On top of the network refetch, the dashboard runs a local clock that re-evaluates time-based labels (detection ages, the NEW window classification, funding countdowns) every 10 seconds while the Arbitrage view is active, and every 60 seconds while you are on another view.
The unseen badge on the toolbar
While you are on another view, the Arbitrage tab in the top toolbar shows a numeric badge: the count of New Entries detected plus Price Spikes updated since you last looked at the dashboard. The moment you leave the Arbitrage view, the app records a last-seen timestamp in your browser and resets the badge to zero, so the badge always means "things that happened while you were away". The narrow-layout panel tabs (New Entries, Price Spikes) carry the same per-panel counts.
Status banners and error states
| On-screen text (verbatim) | What it means |
|---|---|
| Loading arbitrage data... | First load of the snapshot is still in flight. |
| Price/status freshness degraded. Results may be stale. | Orange banner. The server marked the current snapshot as degraded: some price or status sources fell behind their freshness gates. Treat spreads in this state as indicative only. |
| Failed to load backend arbitrage feed. | The snapshot request failed. The dashboard retries on its normal cadence; rate-limited responses are retried after the server-provided wait. |
Heads up: The empty-state hint inside the Opportunities panel reads auto-refreshes every 30s. That is the Pro cadence. Guest and Free sessions refetch every 60 seconds, with the additional ~3 second public release delay described above.
The Arbitrage Opportunities panel
This is the main book. Each row is an asset with its best current buy venue and sell venue; alternates for the same asset are folded underneath. The panel header tells you how the book is filtered before you read a single row.
Header anatomy
- Arbitrage Opportunities title and count line
Under the title sits a count line in the form
>=5% (3) | List 24. The percentage is the server-side high-spread threshold (the server sends it with every snapshot; it defaults to 5%). The number in parentheses is how many assets currently sit at or above that threshold. List is the number of asset groups currently displayed after all filters.- Min percentage input
The minimum spread an opportunity must show to appear in the list, labeled Min with a % suffix (accessible name Arbitrage Min %, step 0.1). It exists so you can cut low-spread noise without touching any other filter. For Pro accounts the floor is 0, so you can show everything. For guest and Free sessions the field is read-only and pinned at 0.1%; clicking it raises the Pro upgrade toast described in Sidebar filters.
- {N} hidden control
Appears once you have hidden at least one asset with the eye button. Clicking it switches the panel into a review mode listing only your hidden assets, with Unhide all and Keep buttons. Full behavior, including Telegram sync, is covered in Hiding assets.
- Collapse button (mobile)
On small screens the panel exposes a Collapse button (accessible name Collapse list) to fold the list out of the way.
Category tabs and subtabs
Filtering is layered: a category, then a subtab inside the category, then in one case a sub-subtab. The default category is Spot.
| Level | Tabs (verbatim) | Notes |
|---|---|---|
| Category | All / Spot / Perp | Default is Spot. |
| Spot subtabs | All / CEX-DEX / CEX-CEX / DEX-DEX | Selects the venue pairing of the two legs. |
| CEX-CEX subtabs | All / Kimchi Premium / KR Premium | Only shown when CEX-CEX is selected, but the chosen subtype keeps applying to CEX-CEX rows even when you switch the category back to All. |
| Perp subtabs | All / Perp-Spot / Perp-Perp | Perp-Spot pairs a perpetual market against a spot venue; Perp-Perp pairs two perpetual markets. |
The two Korean-market subtypes have exact definitions, derived from which legs sit on a Korean exchange (Upbit or Bithumb):
| Subtab | Definition | Example |
|---|---|---|
| Kimchi Premium | Exactly one of the two legs is on a Korean exchange. | Buy on Binance, sell on Upbit. |
| KR Premium | Both legs are on Korean exchanges. | Buy on Bithumb, sell on Upbit. |
The Bridge filter
- Bridge filter: All / Exec Route
-
All shows every row. Exec Route keeps only opportunities that are executable from a routing standpoint: either no bridge is needed (both legs reachable on the same chain or via deposit/withdraw), or a live bridge route exists between the chains involved. Rows that would require a bridge hop with no known live route are filtered out.
Perp rows are exempt from this filter. Perpetual positions are margin-based, so no token has to physically move across chains for the position to be opened; bridging is irrelevant to them.
The Bridge filter is shared between the Opportunities panel and the New Entries panel: changing it in one changes it in the other. The category and subtab selections, by contrast, are independent per panel.
Grouping, sorting, and pagination
- Asset grouping with +{N} more / Hide {N}
Rows are sorted by spread, highest first, then grouped by asset. The best row for each asset is shown as the primary card; the remaining venue pairings for the same asset collapse behind a +{N} more button. Expanding shows them with Alt 1, Alt 2 badges, and the button flips to Hide {N}. Alternates whose spread falls below the primary spread of the 10th-ranked asset group are trimmed from the expansion, which keeps the long tail from burying the list.
- Show 10 more / Collapse pagination
The panel starts with the top 10 asset groups. Show 10 more appends the next 10 and a meta counter shows
{visible} / {total}. Once everything is expanded the button becomes Collapse. Changing any filter resets the list back to the first 10.- Empty state
When nothing passes the filters you see the title No Opportunities with the description No routable positive-spread opportunities in the current snapshot (or No Spot opportunities in the current snapshot / No Perp opportunities in the current snapshot when a category is selected) and the hint auto-refreshes every 30s.
Opportunity card anatomy
Every element on a card carries meaning. This section walks the card top to bottom: the header row, the badge set, the two route legs, and the perp metadata row.
Header row
- Asset symbol link
The asset symbol is a real link to
/graph?asset={id}. Clicking it switches to the Graph view and opens that asset's Token Flow overlay, where you can see every chain, CEX, DEX, and bridge route the asset touches. Use it to sanity-check transfer paths before acting on a spread.- Type badge
Shown only while the subtab is All, since otherwise the tab itself already tells you the type: CEX-DEX, CEX-CEX, DEX-DEX, Perp-Spot, or Perp-Perp.
- Chain route
Shows the buy-side chain, an arrow, and the sell-side chain. If both legs are on the same chain only one chain is shown. When a leg spans multiple chains, the first chain is shown with a +{N} button that expands the full list; less collapses it again. If no chain is known the slot shows an unknown tag.
- Spread number
Right-aligned, formatted as
+{X.XX}%. It renders green when the spread is at or above the server high-spread threshold (default 5%) and yellow below it.- Eye button
Hides the whole asset from the panel. Tooltip Hide this asset, or Unhide this asset when reviewing the hidden list. See Hiding assets for what this actually stores and syncs.
Badge reference
| Badge | When it appears | Exact meaning |
|---|---|---|
| NEW | The card's buy/sell pair entered the book inside the new-entry window (about 1 hour, server-defined). | This pair also qualifies for the New Entries panel, subject to that panel's own Min % and category filters. The badge drops off automatically once the window passes; the local 10-second clock keeps the classification current between refetches. |
| >=5% | Spread at or above the server high-spread threshold. | The number in the badge is the live threshold from the snapshot, not a hardcoded 5. The card also gets a green highlight. |
| Bridge | The legs sit on different chains and a live bridge route exists between them. | Moving the asset between the two legs is possible via a known route. Pro responses additionally carry the bridge fee, ETA, and credit data for the route; these fields are withheld from the public feed. |
| Need bridge | The legs sit on different chains and no live bridge route is known. | The spread exists on paper but the system cannot point to a route that moves the asset between the chains. The Exec Route filter removes these rows. |
| Diff contract | Both legs are on the same chain but reference different token contracts. | Tooltip (verbatim, same-chain case): Same chain ({chain}) but the buy and sell legs use different token contracts — not directly transferable, verify convertibility. When the chain is unknown: Buy and sell legs use different token contracts on the same chain — verify convertibility. |
| FALLBACK | A leg's price came from a fallback quote rather than the regular fresh path. | Shown on the affected leg. Pro accounts also see a reason: {fallback_reason} line under the leg; the reason field is omitted from the public feed. |
| Alt 1, Alt 2... | On rows expanded via +{N} more. | Marks alternate venue pairings for the same asset, ranked below the primary row. |
Hard gate for your own checks: Diff contract means the two legs are not the same contract even though the chain matches. Wrapped versions, bridged versions, and reissued tokens often share a symbol. Always verify convertibility between the exact contracts before treating the spread as actionable.
Route legs: Buy and Sell
Each card carries two legs. The buy leg has a green dot and the header Buy · {VENUE}; the sell leg has a red dot and Sell · {VENUE}. DEX legs append the chain, for example chain: eth.
| Venue kind | Internal key (example) | Displayed as |
|---|---|---|
| DEX | dex:uniswap:v3:eth | UNISWAP V3 plus the chain note chain: eth |
| CEX spot (USDT market) | cex:binance:spot_usdt | BINANCE SPOT |
| CEX spot (KRW market) | cex:upbit:spot_krw | UPBIT KRW |
| CEX perp | cex:binance:perp_usdt | BINANCE PERP |
- Leg price
Each leg shows its quoted price, green on the buy side and red on the sell side. In the New Entries panel the same leg shows two prices with an arrow: the price at detection, then the current price.
- FALLBACK badge and reason: {fallback_reason}
If a leg's quote came from a fallback path the leg carries the FALLBACK badge. Pro accounts see an extra line, reason: followed by the machine reason string, so you can judge how much to trust the number. Public responses do not include the reason field.
- token and pool address rows (Pro)
On DEX legs, Pro accounts get a token row with the chain-specific contract identifier and a pool row with the pool id. Values longer than 16 characters display as the first 8 characters, an ellipsis, and the last 6; the tooltip holds the full value. Clicking copies the full string to the clipboard, and the copy glyph flips to a checkmark for about 1.2 seconds to confirm.
- Locked address row (guest / Free)
Without Pro, the token row renders as the masked placeholder 0x•••••••• with a lock icon. Tooltip: Upgrade to Pro to view contract addresses. Clicking it raises the Pro toast with the label contract address. The masking is enforced server-side: public API responses simply do not contain the identifiers, so the lock is not hiding data that is present in your browser.
Perp metadata row
Cards of type Perp-Spot and Perp-Perp carry an extra row of funding and open-interest data, because for perps the funding rate is part of the economics of holding the position.
- Fund ({N}h) funding rate and countdown
The funding rate of the perp leg, shown to 4 decimal places, with the funding interval in hours in parentheses. Positive rates render green, negative rates red. After a / separator, a live countdown in
HH:MM:SSshows time remaining until the next funding event.- Fund(L) / Fund(S) (Perp-Perp only)
Perp-Perp cards show two funding entries: Fund(L) for the long leg and Fund(S) for the short leg, each with its own rate and countdown.
- OI open interest
Open interest of the perp market, abbreviated in dollars (for example
$1.2Mor$340K). Perp-Perp cards show both markets aslo / hi. Low open interest is your cue that the market may not absorb size.- Blocked reason
When the system's own execution viability check fails for the perp pairing, the card displays the blocking reason as plain text. The viability flag is a premium-scoped field, so this readout is part of the Pro response.
The New Entries panel
New Entries answers a different question than the main book: not "what spreads exist", but "what spreads just appeared". An opportunity qualifies when the server flags it as a new entry and its recorded entry time is inside the server's new-entry window, which defaults to about 1 hour. Rows are sorted by detection time, newest first. Fresh gaps matter because the earliest minutes of a gap are when it is least likely to have been arbitraged away already.
Header and filters
- New Entries title and count line
The count line reads {N} asset(s) | {M} pair(s): how many distinct assets and how many buy/sell pairs are currently inside the window and passing your filters.
- Min percentage input
Minimum spread for a new entry to appear (accessible name New Gaps Min %, step 0.5). Pro accounts can set it down to the 1% floor. Guest and Free sessions see it read-only, pinned at 5%.
- Filter set
The panel has its own copy of the category tabs, Spot/Perp subtabs, and the Kimchi Premium / KR Premium subtabs, independent from the Opportunities panel. Only the Bridge filter (All / Exec Route) is shared between the two panels.
- Empty state
Monitoring for new gaps... means the feed is healthy but nothing inside the window passes your filters.
What a New Entry card adds
- Detection age
Each card shows how long ago the gap was detected: just now, then {N}s ago, {N}m ago, {N}h ago. Cards detected within the last 5 minutes get a green highlight border, so the freshest gaps stand out at a glance.
- Entry spread versus current spread
The spread is shown as a pair with an arrow, for example
+5.20% → +7.10%: the spread at detection (tooltip Spread at detection) and the live spread now. If they differ by at least 5 basis points a delta chip appears, green with a+when the gap widened and red when it narrowed. A widening gap can mean the move is still developing; a collapsing gap usually means it is being closed.- Entry price versus current price per leg
The route legs render in entry-price mode: each leg shows the price at detection, an arrow, and the current price, so you can see which side of the gap moved.
- Everything else
Asset link, type badge, chain route, Bridge / Need bridge / Diff contract badges, +{N} more grouping, address rows and locks, and the eye button behave exactly as described in Card anatomy.
The Price Spikes panel
Price Spikes watches individual venues for abrupt price moves, independent of whether a cross-venue arbitrage currently exists. It is the panel that catches depegs, exploits, listings dumps, and thin-pool repricings as they happen.
The two spike types, precisely
| Badge | Plain-language definition | Math | Sign on screen |
|---|---|---|---|
| Buy Drop | The price you would pay to buy right now collapsed relative to the venue's baseline sell price a window ago. The asset suddenly got cheap to acquire. | (previous sell price - current buy price) / previous sell price at or above the window threshold |
Negative, for example -25.51% |
| Sell Rise | The price you would receive selling right now jumped relative to the venue's baseline buy price a window ago. The asset suddenly became expensive to sell into. | (current sell price - previous buy price) / previous buy price at or above the window threshold |
Positive, for example +18.40% |
Note: Before a spike is published, the engine cross-checks the move against another venue's price at the same moment, so a single venue feeding bad data does not by itself produce a spike. A rare card may carry the generic Spike badge when the side is not one of the two standard types.
Windows and thresholds
Each spike is measured over one of six look-back windows. The window grid at the top of the panel lets Pro accounts choose which windows are shown and the minimum spike percentage per window. Larger windows use higher default thresholds because slow drift over an hour is normal, while a 30 percent move in 30 seconds is not.
| Window label | Window | Default web min % | Active in the Free filter grid |
|---|---|---|---|
| 30s | 30 seconds | 30% | Yes |
| 1m | 1 minute | 40% | No |
| 5m | 5 minutes | 50% | Yes |
| 15m | 15 minutes | 70% | No |
| 30m | 30 minutes | 80% | No |
| 1h | 1 hour | 90% | No |
- Price Spikes title and count line
The count line reads {N} down / {M} up | {total}: down counts Buy Drop spikes (red), up counts Sell Rise spikes (green). When nothing is live it reads 0 spikes.
- All toggle and window grid
The filter bar holds an All toggle plus one cell per window. Each cell shows the window label and a minimum-percent input (accessible name {window} min %, step 5, floor 10%). For Pro accounts, clicking a cell toggles that window on or off and the inputs are editable. For guest and Free sessions all six window options are displayed but only 30s and 5m appear active, the inputs are read-only, and interacting raises the Pro toast with the label spike windows.
- Filtering scope
Window and minimum-percent filtering is applied client-side for Pro accounts on the premium spikes feed. Public sessions receive the server-curated public spikes feed as-is; the only filtering applied locally is your hidden assets plus the CEX and chain mute lists described in Hiding assets.
- Empty state
No active price spikes detected.
Spike card anatomy
- Asset link and side badge
The asset symbol links to the Token Flow view, same as opportunity cards. Next to it sits the side badge: Buy Drop, Sell Rise, or Spike.
- Window chip and update age
A chip shows the window the spike was measured over (30s, 5m, and so on; n/a if unknown), followed by how long ago the spike record last updated, for example 2m ago.
- Detection percent versus live percent
On the right the card shows the spike magnitude at detection and the live magnitude with an arrow, for example
-25.51% → -18.20%(tooltips Spike % at detection and Live spike %). If the two differ by at least 1 percentage point a delta chip appears; if they differ by less than 0.1 percentage points the card collapses them into a single number. A live value drifting back toward zero means the move is retracing.- Venue line
The detail area names the venue, shows a chain chip, and stamps the source data age as snapshot {N}m ago.
- Price rows
Two rows show the raw move: buy previous price, arrow, current price; and sell previous price, arrow, current price. If both sides fired on the same venue, a secondary row such as Sell Rise: +{x}% reports the other side's magnitude.
- token / pool rows
Identical to opportunity cards: for spikes on DEX venues, Pro accounts get copyable token and pool rows; guest and Free sessions see the locked 0x•••••••• row with the Upgrade to Pro to view contract addresses tooltip.
- Resolved spikes
When a spike resolves (the move retraced or the record went inactive) the card fades instead of vanishing instantly, and it remains in the feed for the server retention window of about 10 minutes. The fade tells you the event already played out.
- Eye button
Hides the asset from the spikes panel. This uses the dedicated price-spike hidden scope, separate from the opportunities scope; see Hiding assets.
Hiding assets and Telegram mute sync
The eye button looks like a cosmetic filter, but for signed-in accounts it writes to the same server-side lists that drive your Telegram alert mutes. Hiding an asset on the dashboard and muting it for Telegram are one action on one list, not two settings to keep in sync.
| Scope | What the eye button hides | Where it is stored |
|---|---|---|
| Spot opportunities | The asset across the Opportunities and New Entries panels (spot categories). | Signed-in accounts: synced with your Telegram hidden-assets list on the server (about 1 second after the click, with offline retry). Guests: browser-local only, but local hides are pushed up to the server after you sign in. |
| Perp opportunities | The asset within the Perp category only. | Browser-local only. The perp hidden set never syncs to the server or to Telegram. |
| Price spikes | The asset within the Price Spikes panel. | Signed-in accounts: synced with your Telegram price-spike hidden-assets list, a separate list that starts empty and does not inherit the spot list. |
Heads up: Because the spot and spike scopes are the same lists your Telegram alerts use, hiding an asset here also silences its Telegram alerts for that scope, and unmuting it in My Page makes it reappear on the dashboard. If an asset you expect is missing from a panel, check your hidden list before assuming the data is wrong.
- {N} hidden, then Unhide all / Keep
Each panel header shows {N} hidden when its scope has hidden assets. Clicking it lists the hidden assets so you can review them. Unhide all clears the scope in one click; Keep exits review mode without changes. Individual assets can be restored with the eye button (Unhide this asset).
- Default hidden seed
A small starter list ships hidden by default in the browser (seven spot assets and five perp assets, mostly chronically noisy tickers). If the dashboard seems to be missing a well-known asset on a fresh browser, open {N} hidden and unhide it.
- CEX and chain spike mutes
Beyond per-asset hiding, your account can mute price spikes from entire exchanges or entire chains. Those lists are managed in My Page (Telegram alert rules) and are read by this dashboard: spikes originating from a muted CEX or chain are filtered out of the Price Spikes panel as well. There is no editor for these lists on the dashboard itself.
- List limits
The server-side hidden lists cap at 1000 assets, 100 CEX entries, and 200 chain entries per scope.
The left sidebar: Filters (Pro)
While you are on the Arbitrage view, the left sidebar swaps its Graph-view content (stats and search) for a Filters panel. These are the broad, persistent filters: which venues, which chains, and which thresholds the whole dashboard should respect. Everything here is Pro-gated.
For guest and Free sessions, the heading shows a Premium badge and each section is dimmed under a lock overlay with a lock icon and the text Upgrade to unlock filters. Clicks on locked controls are intercepted, never applied, and raise the Pro toast.
- Section Arbitrage Opportunities: From / To venue filters
-
Restrict the book to opportunities whose buy leg (From) or sell leg (To) is on specific venues. Each side has a search input with the placeholder Search venues... (accessible names Search from venues and Search to venues) plus a row of the four most popular venue chips. Before live options load, placeholder chips show BINANCE, UPBIT, UNISWAP, BINANCE PERP. A clear button removes the selection.
Venues are normalized so you pick at a sensible granularity: a DEX is one entry across its versions and chains, and a CEX splits into spot and perp entries (labeled like BINANCE and BINANCE PERP).
- Section Arbitrage Opportunities: Chains
Restrict opportunities to specific chains. Search input placeholder Search chains..., popular chips (placeholder fallback eth, bsc, arb, sol), and a clear button.
- Section New Entries: Min %
A numeric input (step 0.5) with the hint min 1%. This is the same value as the Min input in the New Entries panel header; the floor is 1%.
- Section Price Spikes: All toggle and window grid
Mirrors the filter bar at the top of the Price Spikes panel: an All toggle plus one cell per window, each with the window label, a minimum-percent input (step 5, floor 10%), and a % suffix. Clicking a cell toggles that window. The window list comes from the premium feed's supported windows; before that response arrives, a placeholder window set may briefly appear.
- Persistence
All sidebar filter values persist in your browser's local storage. They survive reloads on the same browser but do not roam between devices.
The Pro toast
Any locked control on this screen raises the same upgrade toast when clicked. It shows the eyebrow Pro plan and the message Adjusting {label} requires an upgrade, where the label names the control in lowercase: min spread filter, spike windows, or contract address (generic fallback Pro filter). It carries an Upgrade button that opens My Page and a close button (accessible name Dismiss), and it dismisses itself after about 4.2 seconds.
Free vs Pro on this screen
Everything on the dashboard is visible to everyone in structure; what changes with Pro is editability, field visibility, and cadence. The locks are enforced on the server: masked fields are absent from public API responses, not merely blurred in the browser.
| Surface | Guest / Free | Pro |
|---|---|---|
| Opportunities Min | Read-only, fixed at 0.1% | Editable, floor 0 |
| New Entries Min | Read-only, fixed at 5% | Editable, floor 1% |
| Spike windows | Only 30s and 5m shown active; thresholds read-only | All six windows toggleable; per-window min % editable with a 10% floor |
| Sidebar Filters | Locked overlay: Upgrade to unlock filters | From / To venues, Chains, New Entries Min %, spike window grid |
| Masked fields | Hidden from the feed: token contract addresses, pool ids, fallback reasons, route hop detail, bridge fee / ETA / credit, perp viability detail; venue names reduced to safe prefixes | Full field set, including copyable token and pool rows and reason: lines |
| Refresh cadence | Refetch every 60 seconds; public snapshots visible about 3 seconds after release | Refetch every 30 seconds |
| Feeds | New Entries derived from the public snapshot; public spikes feed as curated by the server | Dedicated premium new-gaps and spikes feeds with client-side window and threshold filtering |
Note: Upgrading happens in My Page. See Account & billing for plans and the payment flow, and Telegram alerts for what the same thresholds and mute lists control on the alert side.