First-detection case / AGIX
AGIX exploit: first detected by Web3Map
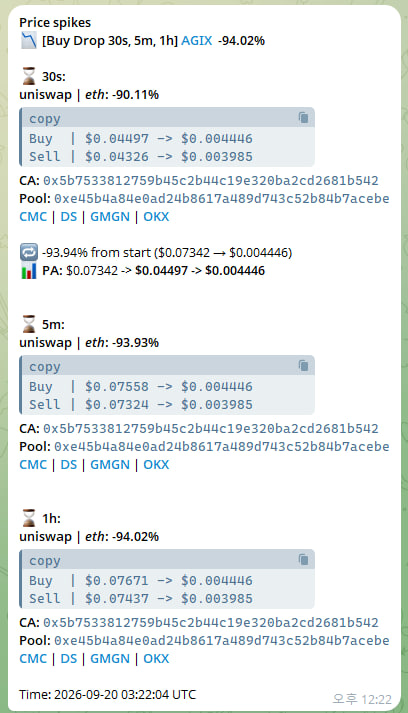
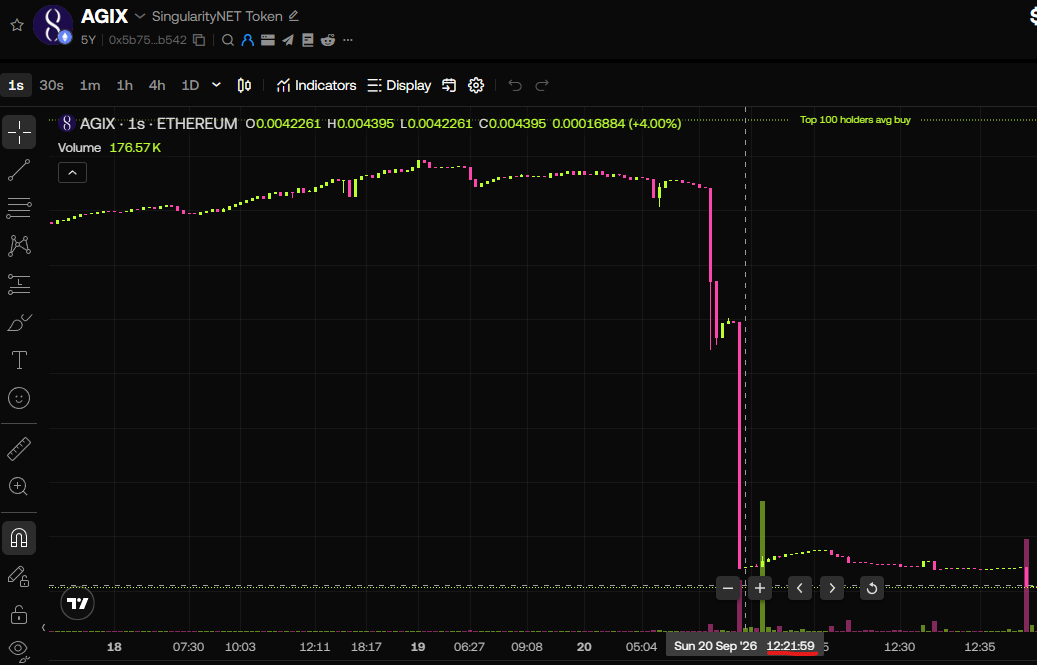
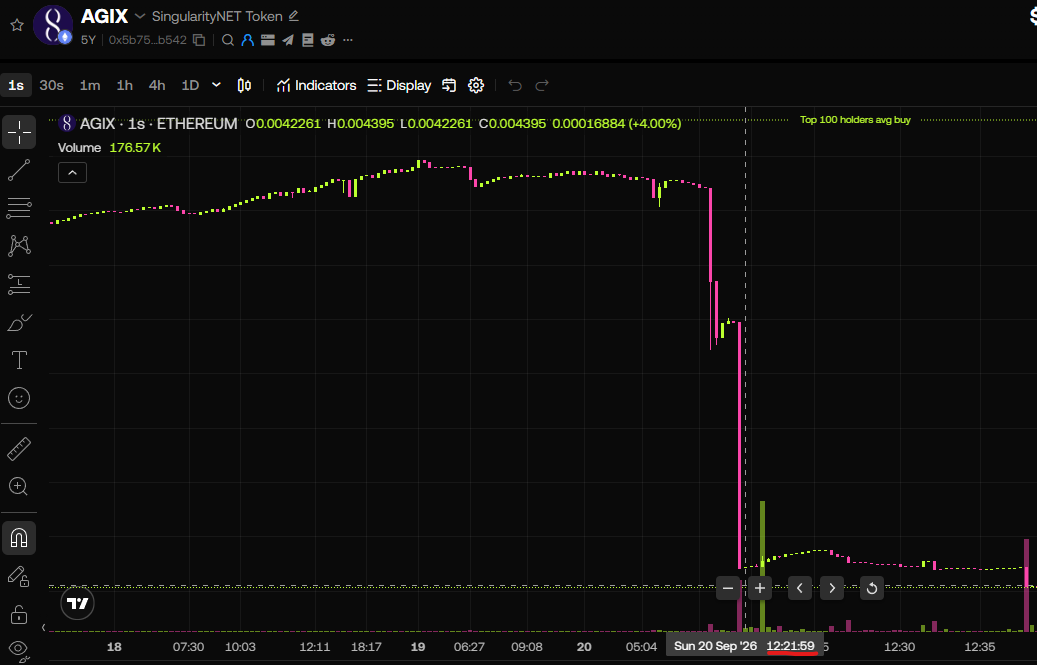
Web3Map was first to detect the AGIX exploit. Its historical Price Spikes alert recorded a -94.02% headline move and identified the affected Ethereum market. The original alert and chart are preserved below.
Alert recorded: · Read the original Web3Map post
An exploit surfaced through an abrupt price crash
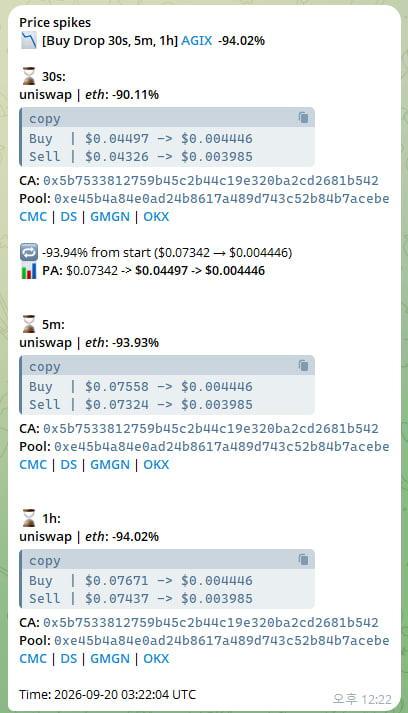
The AGIX case connects crypto hack detection with a sharp market move. Web3Map's Price Spikes alert showed a Buy Drop across the 30-second, five-minute and one-hour windows, alongside the token and pool identifiers for the affected market.
The public recap identifies AGIX, WMTX and another Ethereum token among Web3Map's first exploit detections. This case study focuses on AGIX, for which that post includes a dedicated alert capture and price chart.
The original AGIX price-crash alert
| Observation window | Price change displayed |
|---|---|
| 30 seconds | -90.11% |
| 5 minutes | -93.93% |
| 1 hour | -94.02% |
These percentages are transcribed from the historical alert. Each refers to its stated observation window; a window length is not the detection latency.
The price chart published with the alert
Alert and public recap
| Record | Time | Source |
|---|---|---|
| AGIX price alert | Timestamp printed in the alert capture | |
| Web3Map public recap | Original X post publication |
The alert and recap are separate records. The case preserves when the signal was recorded as well as when the public explanation was published.
From detection to market context
The alert localized the move to AGIX on Uniswap on Ethereum. It gave subscribers an asset, market, observation windows and timestamp to investigate while the price event was unfolding.
This is one of Web3Map's two core workflows: crypto hack, depeg and price-crash detection, alongside cross-market arbitrage monitoring. The Cronos depeg case shows how a stablecoin event appeared in the New Entries stream.
Sources
Web3Map's original AGIX and WMTX exploit recap · Original alert image · Original price chart